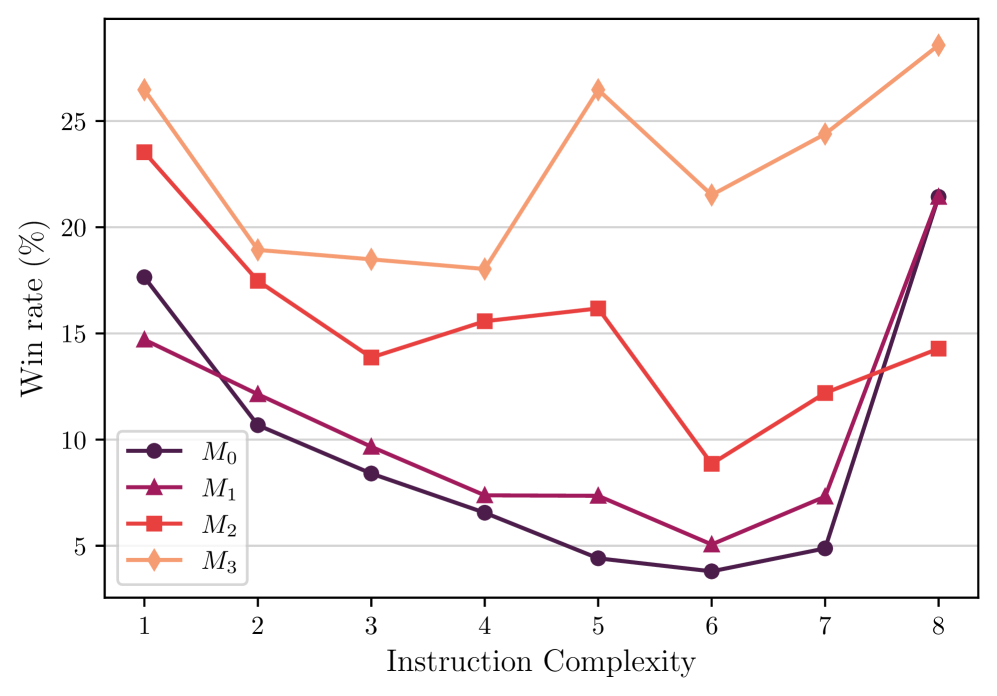
# Technical Data Extraction: Win Rate vs. Instruction Complexity
## 1. Metadata and Axis Information
* **Chart Type:** Multi-series line graph with markers.
* **Y-Axis Label:** Win rate (%)
* **Y-Axis Scale:** 5 to 25 (with major gridlines every 5 units).
* **X-Axis Label:** Instruction Complexity
* **X-Axis Scale:** Discrete integer values from 1 to 8.
* **Legend Location:** Bottom-left corner [approx. x=0.1, y=0.1].
## 2. Legend and Series Identification
The chart tracks four distinct models, differentiated by color and marker shape:
* **$M_0$ (Dark Purple/Black, Circle marker):** Generally the lowest performing series until complexity level 8.
* **$M_1$ (Magenta/Maroon, Triangle marker):** Generally follows a downward trend, staying below $M_2$ and $M_3$.
* **$M_2$ (Red, Square marker):** Mid-tier performance with significant volatility.
* **$M_3$ (Light Orange/Peach, Diamond marker):** The highest performing series across all complexity levels.
---
## 3. Data Series Analysis and Trends
### Series $M_0$ (Dark Purple, Circle)
* **Trend:** Slopes downward steadily from complexity 1 to 6, then shows a sharp, near-vertical spike at complexity 8.
* **Data Points:**
* 1: ~17.5%
* 2: ~10.5%
* 3: ~8.5%
* 4: ~6.5%
* 5: ~4.5%
* 6: ~3.8%
* 7: ~4.8%
* 8: ~21.5%
### Series $M_1$ (Magenta, Triangle)
* **Trend:** Consistent downward slope from complexity 1 to 6, followed by a moderate recovery at levels 7 and 8.
* **Data Points:**
* 1: ~14.5%
* 2: ~12.0%
* 3: ~9.5%
* 4: ~7.5%
* 5: ~7.4%
* 6: ~5.0%
* 7: ~7.2%
* 8: ~21.5% (Converges with $M_0$ at level 8)
### Series $M_2$ (Red, Square)
* **Trend:** Decreases from 1 to 3, rises slightly to 5, drops sharply at 6, and recovers through 8.
* **Data Points:**
* 1: ~23.5%
* 2: ~17.5%
* 3: ~13.8%
* 4: ~15.5%
* 5: ~16.2%
* 6: ~8.8%
* 7: ~12.2%
* 8: ~14.2%
### Series $M_3$ (Light Orange, Diamond)
* **Trend:** Highest win rate overall. Decreases from 1 to 4, spikes at 5, dips at 6, and trends upward to its peak at 8.
* **Data Points:**
* 1: ~26.5%
* 2: ~19.0%
* 3: ~18.5%
* 4: ~18.0%
* 5: ~26.5%
* 6: ~21.5%
* 7: ~24.5%
* 8: ~28.5%
---
## 4. Summary Table of Extracted Values (Approximate %)
| Instruction Complexity | $M_0$ (Circle) | $M_1$ (Triangle) | $M_2$ (Square) | $M_3$ (Diamond) |
| :--- | :--- | :--- | :--- | :--- |
| **1** | 17.5 | 14.5 | 23.5 | 26.5 |
| **2** | 10.5 | 12.0 | 17.5 | 19.0 |
| **3** | 8.5 | 9.5 | 13.8 | 18.5 |
| **4** | 6.5 | 7.5 | 15.5 | 18.0 |
| **5** | 4.5 | 7.4 | 16.2 | 26.5 |
| **6** | 3.8 | 5.0 | 8.8 | 21.5 |
| **7** | 4.8 | 7.2 | 12.2 | 24.5 |
| **8** | 21.5 | 21.5 | 14.2 | 28.5 |
## 5. Key Observations
* **Complexity 6** represents a performance "trough" for all four models.
* **Complexity 8** shows a significant performance anomaly where $M_0$ and $M_1$ experience a massive surge in win rate, while $M_2$ shows only modest gains.
* **$M_3$** maintains a dominant lead throughout the complexity spectrum, particularly at higher complexity levels (5-8).