## Line Chart: Win Rate vs. Instruction Complexity for Four Models
### Overview
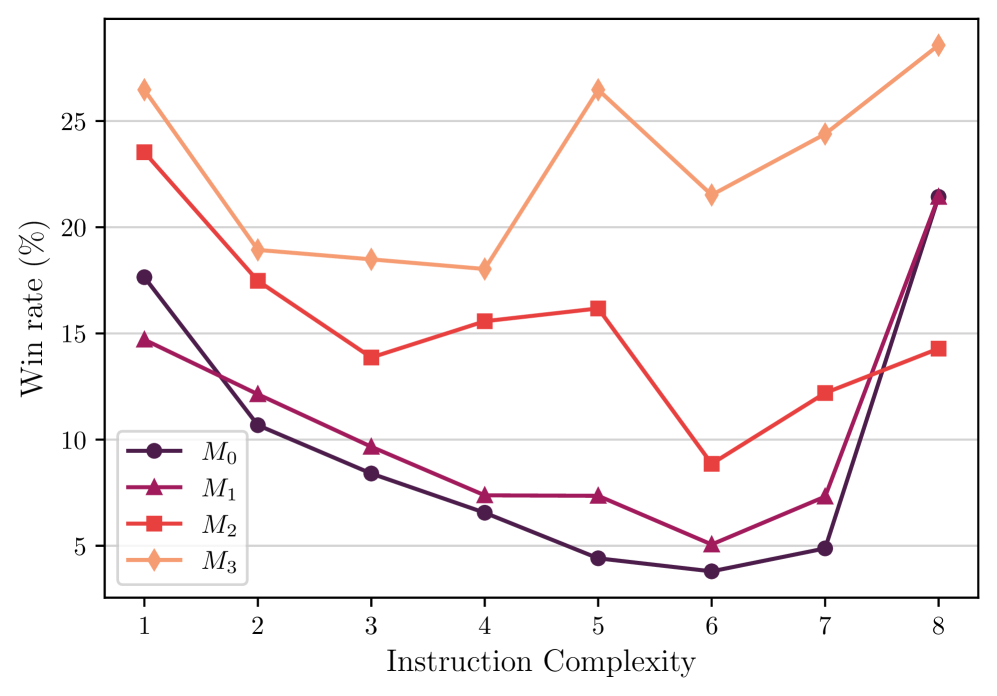
The image displays a line chart comparing the performance of four distinct models (M₀, M₁, M₂, M₃) across eight levels of instruction complexity. The performance metric is "Win rate (%)". The chart reveals that model performance is highly dependent on the complexity level, with different models exhibiting divergent trends.
### Components/Axes
* **Chart Type:** Multi-series line chart with markers.
* **X-Axis:** Labeled "Instruction Complexity". It is a categorical axis with discrete integer markers from 1 to 8.
* **Y-Axis:** Labeled "Win rate (%)". It is a linear numerical axis with major gridlines at intervals of 5%, ranging from 0% to a maximum just above 25%.
* **Legend:** Located in the bottom-left corner of the plot area. It defines four data series:
* **M₀:** Dark purple line with circle markers (●).
* **M₁:** Magenta/dark pink line with upward-pointing triangle markers (▲).
* **M₂:** Red line with square markers (■).
* **M₃:** Light orange/peach line with diamond markers (◆).
### Detailed Analysis
**Data Series and Approximate Values:**
The following table reconstructs the approximate win rate (%) for each model at each instruction complexity level. Values are estimated from the chart's gridlines.
| Instruction Complexity | M₀ (●, Dark Purple) | M₁ (▲, Magenta) | M₂ (■, Red) | M₃ (◆, Orange) |
| :--- | :--- | :--- | :--- | :--- |
| **1** | ~17.5 | ~14.5 | ~23.5 | ~26.5 |
| **2** | ~10.5 | ~12.0 | ~17.5 | ~19.0 |
| **3** | ~8.5 | ~9.5 | ~14.0 | ~18.5 |
| **4** | ~6.5 | ~7.5 | ~15.5 | ~18.0 |
| **5** | ~4.5 | ~7.5 | ~16.0 | ~26.5 |
| **6** | ~4.0 | ~5.0 | ~9.0 | ~21.5 |
| **7** | ~5.0 | ~7.5 | ~12.0 | ~24.5 |
| **8** | ~21.5 | ~21.5 | ~14.0 | ~28.5 |
**Trend Verification (Visual Description):**
* **M₀ (Dark Purple):** Slopes downward from complexity 1 to 6, reaching its minimum. It then rises sharply from complexity 6 to 8.
* **M₁ (Magenta):** Follows a similar but less steep downward trend as M₀ from complexity 1 to 6. It also recovers from complexity 6 to 8, ending at a similar point to M₀.
* **M₂ (Red):** Shows a more volatile trend. It decreases from 1 to 3, increases to a local peak at 5, drops sharply to a minimum at 6, and then recovers moderately through 7 and 8.
* **M₃ (Orange):** Generally maintains the highest win rate. It decreases from 1 to 4, spikes to a peak at 5, dips at 6, and then climbs to its highest point at complexity 8.
### Key Observations
1. **Performance Hierarchy:** Model M₃ (orange diamonds) consistently achieves the highest or near-highest win rate at every complexity level except complexity 6, where M₀ and M₁ perform poorly but M₃ still leads.
2. **Critical Complexity Level 6:** All four models experience a significant performance dip at instruction complexity level 6. This is the lowest point for M₀, M₁, and M₂, and a local minimum for M₃.
3. **Recovery at High Complexity:** Models M₀ and M₁ show a dramatic recovery in win rate at the highest complexity levels (7 and 8), converging with each other. M₂ shows a modest recovery, while M₃ continues to improve.
4. **Divergence at Low Complexity:** At the lowest complexity (1), there is a wide spread in performance, with M₃ leading and M₁ trailing. The models converge somewhat in the mid-range (3-4) before diverging again.
### Interpretation
The data suggests that "Instruction Complexity" is a critical factor influencing model performance, but its effect is non-linear and model-specific.
* **Model Robustness:** M₃ appears to be the most robust model overall, maintaining high win rates across the spectrum. Its peak at complexity 5 and ultimate high at complexity 8 suggest it may be particularly well-optimized for handling both moderately complex and very complex instructions.
* **The "Complexity Valley":** The universal dip at complexity 6 indicates a potential "valley of difficulty" – a specific range of instruction complexity that poses a unique challenge for all tested models. This could represent a transition point where problem-solving strategies that work for lower complexities fail, but more advanced strategies (effective for higher complexities) are not yet fully engaged.
* **Specialization vs. Generalization:** The sharp recovery of M₀ and M₁ at high complexity might indicate they are specialized models that underperform on intermediate tasks but possess strong capabilities for the most complex instructions. In contrast, M₂'s volatile performance suggests less predictable behavior.
* **Practical Implication:** When deploying these models, one should consider the expected complexity of user instructions. For consistently high performance, M₃ is the best choice. If the task domain is known to involve very high complexity, M₀ or M₁ could be viable alternatives, but they would be poor choices for mid-range complexity tasks. The universal weakness at level 6 warrants further investigation into the nature of instructions at that complexity.