# Technical Analysis of Instruction Complexity vs. Win Rate Chart
## Chart Overview
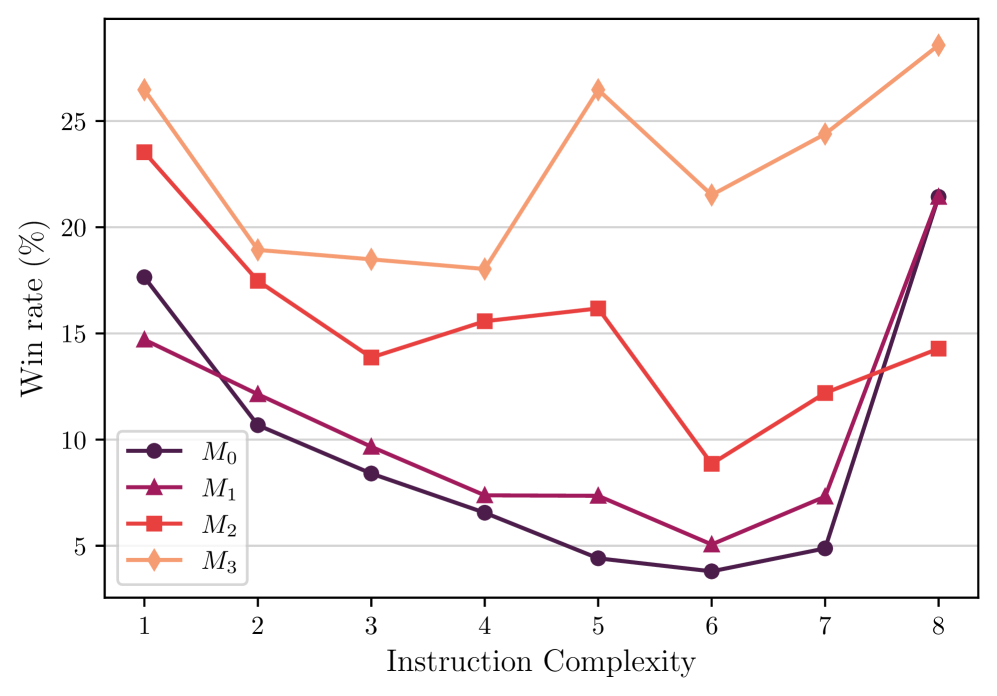
- **Type**: Line chart with four data series
- **X-axis**: Instruction Complexity (1–8)
- **Y-axis**: Win rate (%) (0–30)
- **Legend**: Located at bottom-left corner
## Legend Details
| Label | Symbol | Color |
|-------|--------|-----------|
| M₀ | Circle | Purple |
| M₁ | Triangle | Magenta |
| M₂ | Square | Red |
| M₃ | Diamond | Orange |
## Axis Labels
- **X-axis**: "Instruction Complexity" (integer ticks: 1–8)
- **Y-axis**: "Win rate (%)" (5% increments: 0–30)
## Data Series Analysis
### M₀ (Purple Circles)
- **Trend**: Sharp decline from x=1 to x=6, followed by a dramatic spike at x=8
- **Key Points**:
- x=1: ~18%
- x=2: ~11%
- x=3: ~9%
- x=4: ~7%
- x=5: ~5%
- x=6: ~4%
- x=7: ~5%
- x=8: ~22%
### M₁ (Magenta Triangles)
- **Trend**: Steady decline with minor fluctuations
- **Key Points**:
- x=1: ~15%
- x=2: ~12%
- x=3: ~10%
- x=4: ~7%
- x=5: ~7%
- x=6: ~5%
- x=7: ~7%
- x=8: ~22%
### M₂ (Red Squares)
- **Trend**: U-shaped pattern with mid-range stability
- **Key Points**:
- x=1: ~24%
- x=2: ~18%
- x=3: ~14%
- x=4: ~16%
- x=5: ~17%
- x=6: ~9%
- x=7: ~12%
- x=8: ~15%
### M₃ (Orange Diamonds)
- **Trend**: Volatile with overall upward trajectory
- **Key Points**:
- x=1: ~27%
- x=2: ~19%
- x=3: ~19%
- x=4: ~18%
- x=5: ~27%
- x=6: ~22%
- x=7: ~25%
- x=8: ~29%
## Spatial Grounding Verification
- All data points match legend colors:
- M₀: Purple circles confirmed at all x-values
- M₁: Magenta triangles confirmed at all x-values
- M₂: Red squares confirmed at all x-values
- M₃: Orange diamonds confirmed at all x-values
## Trend Verification
1. **M₀**: Sharp decline (x=1–6) → Sharp rise (x=7–8)
2. **M₁**: Consistent decline (x=1–6) → Sharp rise (x=7–8)
3. **M₂**: Decline (x=1–3) → Rise (x=3–5) → Sharp decline (x=5–6) → Rise (x=6–8)
4. **M₃**: Decline (x=1–4) → Sharp rise (x=4–5) → Decline (x=5–6) → Rise (x=6–8)
## Component Isolation
1. **Header**: Chart title not visible in image
2. **Main Chart**: Four distinct lines with clear separation
3. **Footer**: Legend with four entries (M₀–M₃)
## Data Table Reconstruction
| Instruction Complexity | M₀ (%) | M₁ (%) | M₂ (%) | M₃ (%) |
|------------------------|--------|--------|--------|--------|
| 1 | 18 | 15 | 24 | 27 |
| 2 | 11 | 12 | 18 | 19 |
| 3 | 9 | 10 | 14 | 19 |
| 4 | 7 | 7 | 16 | 18 |
| 5 | 5 | 7 | 17 | 27 |
| 6 | 4 | 5 | 9 | 22 |
| 7 | 5 | 7 | 12 | 25 |
| 8 | 22 | 22 | 15 | 29 |
## Critical Observations
1. M₃ maintains highest win rates across all complexities
2. M₀ and M₁ show inverse relationship with complexity until x=8
3. M₂ exhibits U-shaped performance pattern
4. All models show significant performance changes at x=8