\n
## Diagram: System Block Diagram
### Overview
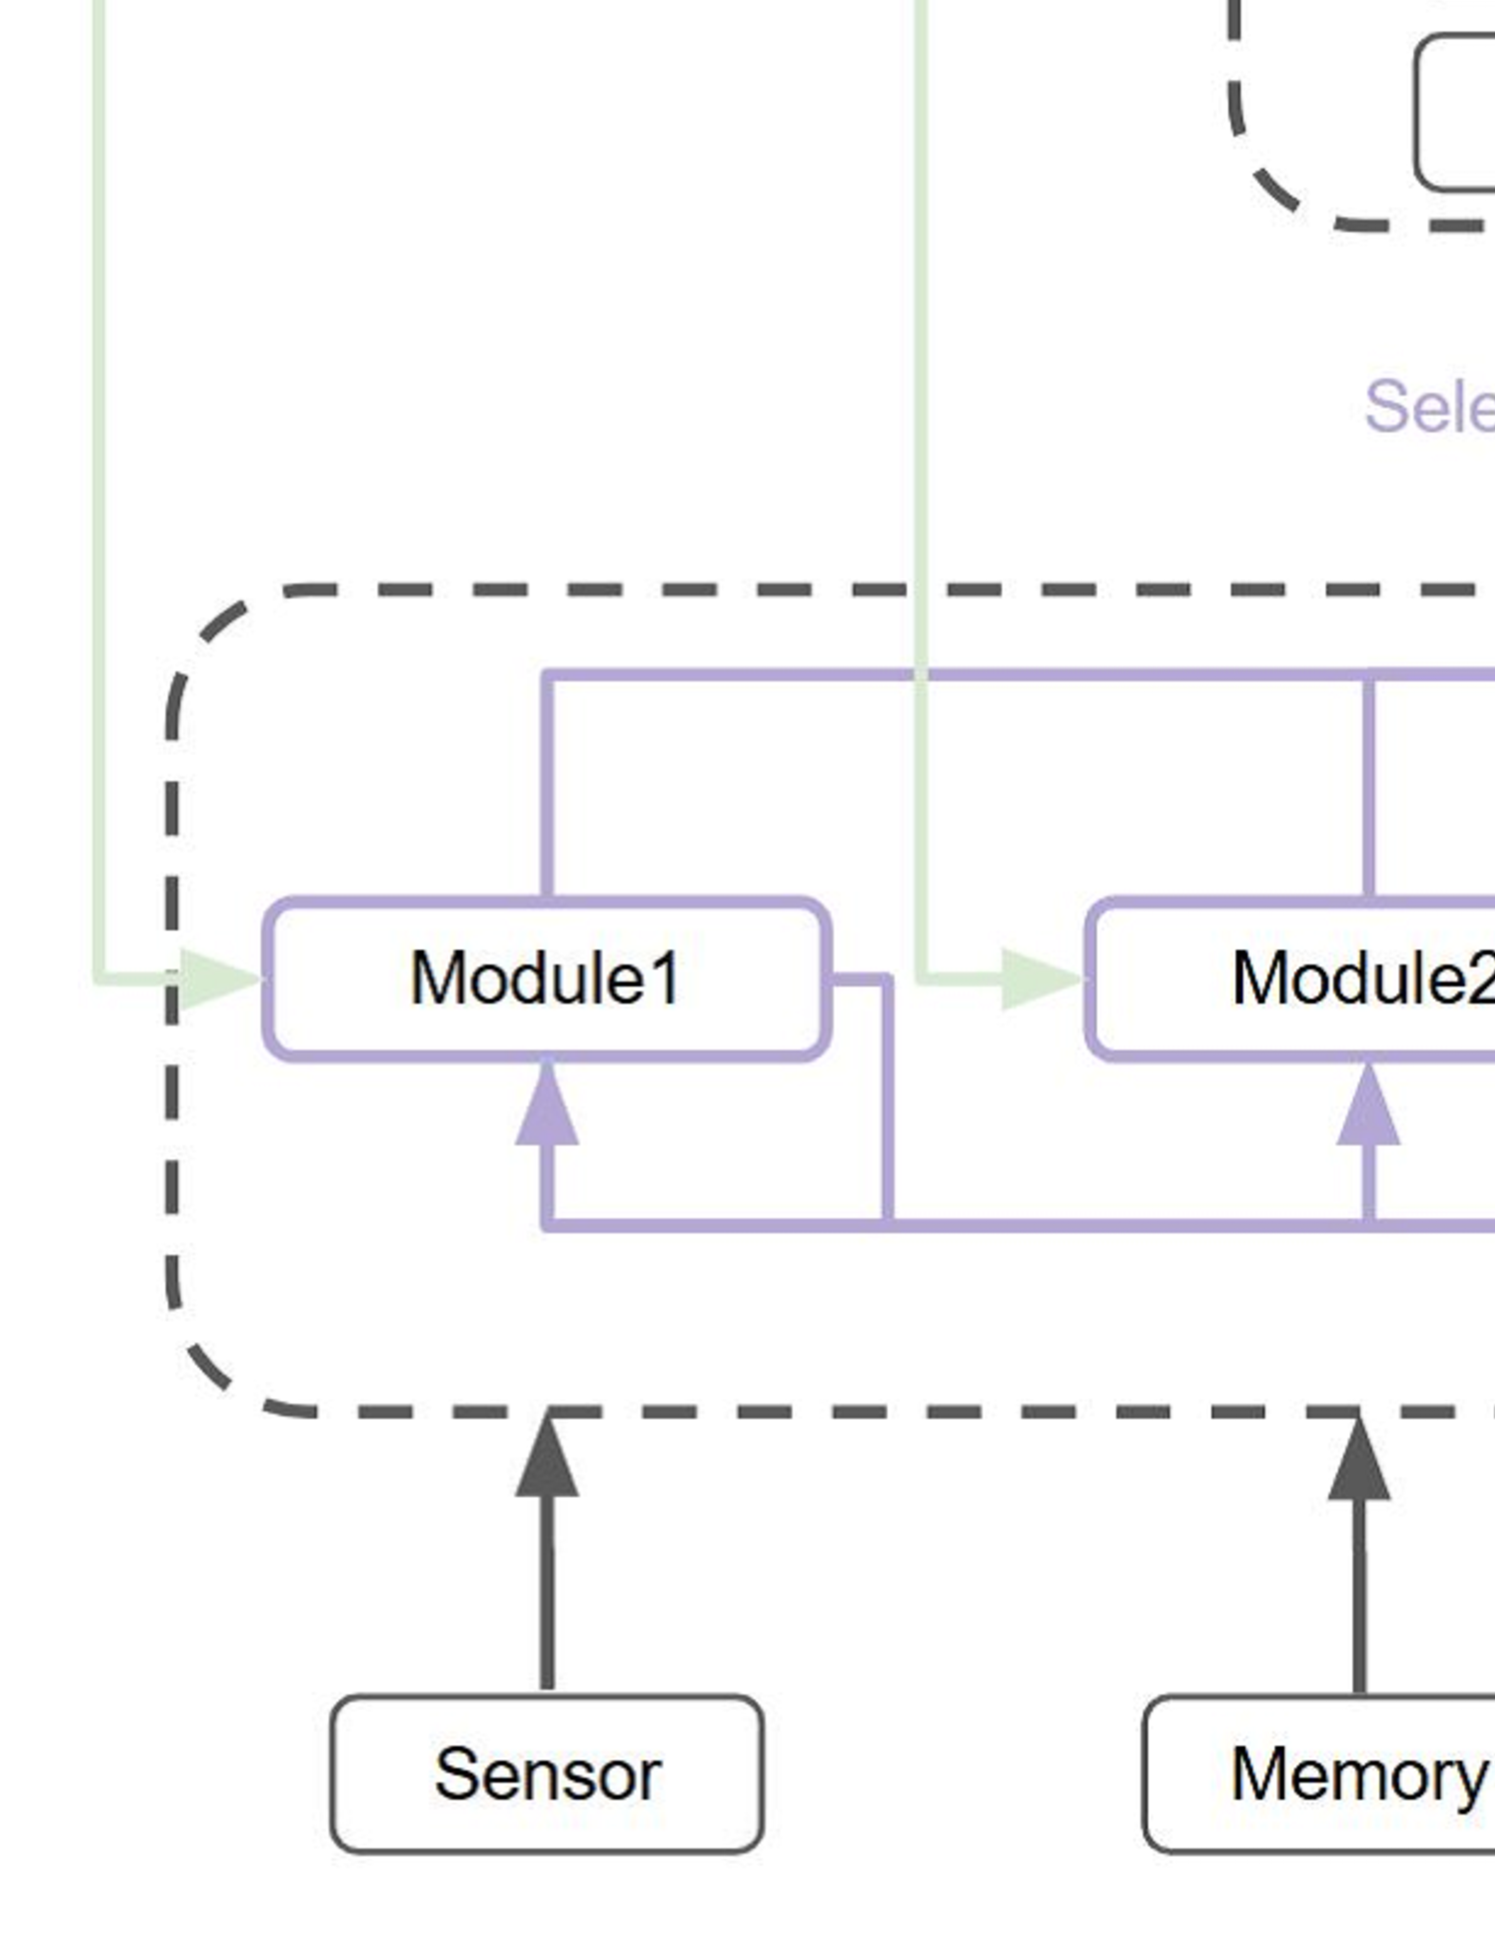
The image depicts a simplified block diagram of a system, likely an electronic or software architecture. It shows the interconnection of several modules: Sensor, Memory, Module1, Module2, and a Selector component. The diagram uses rectangular blocks to represent components and arrows to indicate data or control flow. Dashed lines enclose certain sections, potentially indicating functional groupings or boundaries.
### Components/Axes
The diagram contains the following components:
* **Sensor:** A source of input data.
* **Memory:** A storage component.
* **Module1:** A processing unit.
* **Module2:** Another processing unit.
* **Selector:** A component that appears to choose between outputs.
There are no explicit axes or scales in this diagram. The flow is indicated by arrows.
### Detailed Analysis or Content Details
The diagram shows the following connections:
1. **Sensor to Module1:** An arrow points from the "Sensor" block to the "Module1" block, indicating data flow.
2. **Memory to Module2:** An arrow points from the "Memory" block to the "Module2" block, indicating data flow.
3. **Module1 to Module2:** An arrow points from the "Module1" block to the "Module2" block, indicating data flow.
4. **Module2 to Selector:** An arrow points from the "Module2" block to the "Selector" block, indicating data flow.
5. **Module1 to Selector:** An arrow points from the "Module1" block to the "Selector" block, indicating data flow.
The "Sensor" and "Module1" are enclosed within a dashed-line rectangle. The "Memory" and "Module2" are enclosed within a dashed-line rectangle.
The text "Selector" is present above the Selector block.
### Key Observations
The diagram suggests a system where data from a sensor and memory are processed by modules, and a selector component determines the final output. The dashed lines suggest that the sensor and module1 form a unit, and the memory and module2 form another unit. The selector receives input from both modules.
### Interpretation
This diagram likely represents a simplified control system or data processing pipeline. The sensor provides initial data, which is processed by Module1. Memory provides data to Module2. Both modules contribute to the selector, which then determines the system's output. The dashed lines suggest modularity and potentially independent operation of the sensor/module1 and memory/module2 units. The selector could be implementing a decision-making process based on the outputs of both modules.
Without further context, it's difficult to determine the specific function of each module or the criteria used by the selector. However, the diagram provides a high-level overview of the system's architecture and data flow. The diagram does not provide any quantitative data or specific parameters. It is a conceptual representation of a system's structure.