## Dependency Tree Diagram: Estimated Tree vs. All Combinations
### Overview
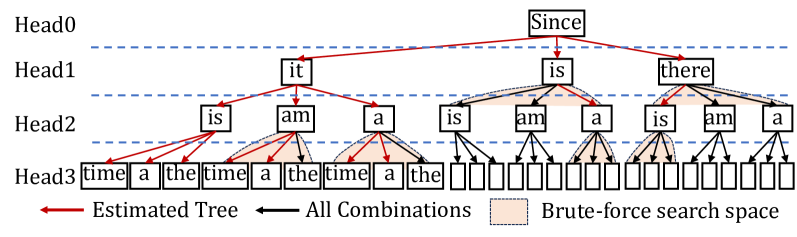
The image is a diagram illustrating a dependency tree structure, comparing an "Estimated Tree" with "All Combinations" within a "Brute-force search space." The diagram is organized into four levels labeled Head0 to Head3, representing hierarchical relationships between words.
### Components/Axes
* **Levels:** The diagram is divided into four horizontal levels, labeled Head0, Head1, Head2, and Head3 from top to bottom. These levels likely represent different stages or depths in the dependency parsing process.
* **Nodes:** Each level contains nodes representing words or phrases. The words are: "Since" (Head0), "it", "is", "there" (Head1), "is", "am", "a" (Head2), and "time", "a", "the" (Head3). Some nodes at Head3 are empty.
* **Edges:** Edges connect the nodes, indicating dependencies between words.
* **Estimated Tree:** Represented by solid red arrows, showing the most likely dependency relationships.
* **All Combinations:** Represented by dashed black arrows, showing all possible dependency relationships.
* **Brute-force search space:** Represented by a shaded orange area, highlighting the combinations considered during the search.
* **Legend:** Located at the bottom of the image.
* Red Arrow: "Estimated Tree"
* Dashed Black Arrow: "All Combinations"
* Orange Shaded Area: "Brute-force search space"
### Detailed Analysis
* **Head0:** Contains a single node with the word "Since".
* **Head1:** Contains three nodes: "it", "is", and "there". The "Since" node in Head0 has red arrows (Estimated Tree) pointing to each of these nodes.
* **Head2:** Contains nine nodes: three "is", three "am", and three "a". The "it" node in Head1 has red arrows (Estimated Tree) pointing to the first "is", "am", and "a" nodes. The "is" node in Head1 has red arrows (Estimated Tree) pointing to the second "is", "am", and "a" nodes. The "there" node in Head1 has red arrows (Estimated Tree) pointing to the third "is", "am", and "a" nodes. Dashed black arrows (All Combinations) also connect the Head1 nodes to the Head2 nodes.
* **Head3:** Contains a mix of filled and empty nodes. The filled nodes contain the words "time", "a", "the", "time", "a", "the". The first "is" node in Head2 has red arrows (Estimated Tree) pointing to the first "time", "a", and "the" nodes. The first "am" node in Head2 has red arrows (Estimated Tree) pointing to the second "time", "a", and "the" nodes. The first "a" node in Head2 has red arrows (Estimated Tree) pointing to the third "time", "a", and "the" nodes. Dashed black arrows (All Combinations) also connect the Head2 nodes to the Head3 nodes.
### Key Observations
* The "Estimated Tree" represents a simplified, likely correct, dependency structure.
* "All Combinations" shows the complexity of considering every possible dependency.
* The "Brute-force search space" highlights the computational cost of exploring all combinations.
* The diagram shows how the number of possible combinations increases as the depth of the tree increases.
### Interpretation
The diagram illustrates the challenge of dependency parsing, where the goal is to find the correct dependency structure among a vast number of possibilities. The "Estimated Tree" represents a heuristic or statistical approach to finding the most likely structure, while "All Combinations" represents the exhaustive search space that a brute-force approach would need to explore. The "Brute-force search space" visually emphasizes the computational complexity of dependency parsing and the need for efficient algorithms to find the correct structure. The diagram suggests that the algorithm starts with the word "Since" and then tries to find the dependencies between the words in the sentence. The red arrows show the most likely dependencies, while the black arrows show all possible dependencies. The orange shaded area shows the combinations that are considered during the search.