## Chart: Mean Success Rate Across Checkpoints
### Overview
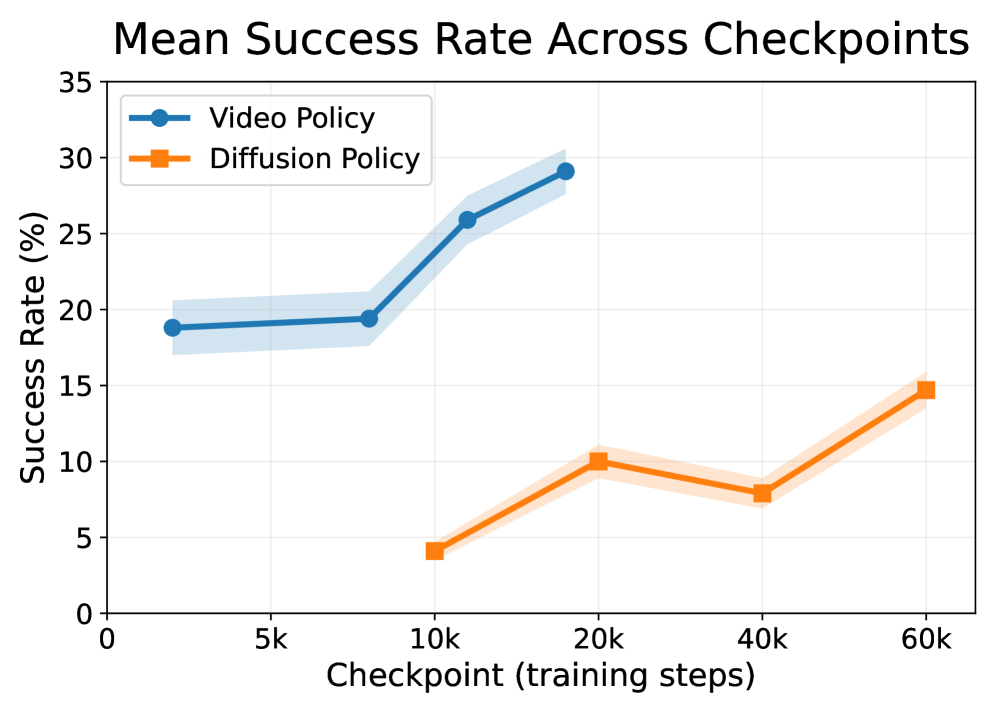
The image is a line graph comparing the mean success rate of a "Video Policy" and a "Diffusion Policy" across different checkpoints during training. The x-axis represents the checkpoint (training steps) in thousands (k), and the y-axis represents the success rate in percentage. Both policies have associated shaded regions indicating variability or confidence intervals.
### Components/Axes
* **Title:** Mean Success Rate Across Checkpoints
* **X-axis:**
* Label: Checkpoint (training steps)
* Scale: 0, 5k, 10k, 20k, 40k, 60k
* **Y-axis:**
* Label: Success Rate (%)
* Scale: 0, 5, 10, 15, 20, 25, 30, 35
* **Legend:** Located in the top-left corner.
* Video Policy (blue line with circular markers)
* Diffusion Policy (orange line with square markers)
### Detailed Analysis
* **Video Policy (blue):**
* Trend: Generally increasing.
* Data Points:
* At 2k-5k Checkpoint: Approximately 19% success rate.
* At 10k Checkpoint: Approximately 19.5% success rate.
* At 20k Checkpoint: Approximately 26% success rate.
* At 20k Checkpoint: Approximately 29% success rate.
* **Diffusion Policy (orange):**
* Trend: Increases initially, then decreases slightly, and increases again.
* Data Points:
* At 10k Checkpoint: Approximately 4% success rate.
* At 20k Checkpoint: Approximately 10% success rate.
* At 40k Checkpoint: Approximately 8% success rate.
* At 60k Checkpoint: Approximately 15% success rate.
### Key Observations
* The Video Policy consistently outperforms the Diffusion Policy across all checkpoints.
* The Video Policy shows a significant jump in success rate between the 10k and 20k checkpoints.
* The Diffusion Policy has a more volatile success rate, with an initial increase, a slight decrease, and then a final increase.
### Interpretation
The data suggests that the Video Policy is more effective than the Diffusion Policy in achieving success across the training checkpoints. The Video Policy's performance improves significantly as training progresses, while the Diffusion Policy's performance is less consistent. The shaded regions around the lines likely represent the variance in the success rate, indicating the reliability of the observed means. The initial flat performance of the Video Policy followed by a sharp increase suggests a critical learning phase between 10k and 20k training steps. The Diffusion Policy's fluctuating performance could indicate instability or sensitivity to specific training parameters.