# Technical Document Extraction
## Figure a: Layer-wise Control Effects
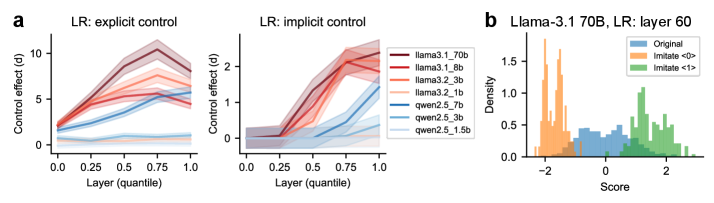
### Graph 1: LR: explicit control
- **X-axis**: Layer (quantile) [0.0, 0.25, 0.5, 0.75, 1.0]
- **Y-axis**: Control effect (d) [0, 5, 10]
- **Lines**:
- Red: llama3.1_70b
- Orange: llama3.1_8b
- Light orange: llama3.2_3b
- Yellow: llama3.2_1b
- Blue: qwen2.5_7b
- Light blue: qwen2.5_3b
- Gray: qwen2.5_1.5b
- **Trends**:
- All models show increasing control effects until ~0.75 quantile
- Peaks vary by model (e.g., llama3.1_70b peaks at ~8d, qwen2.5_1.5b remains flat)
- Shaded regions indicate 95% confidence intervals
### Graph 2: LR: implicit control
- **X-axis**: Layer (quantile) [0.0, 0.25, 0.5, 0.75, 1.0]
- **Y-axis**: Control effect (d) [0, 1, 2]
- **Lines**:
- Same color coding as explicit control
- **Trends**:
- All models show gradual increase until ~0.75 quantile
- Peaks lower than explicit control (max ~2d)
- Confidence intervals narrower than explicit control
## Figure b: Llama-3.1 70B Layer 60 Distribution
- **X-axis**: Score [-2, 0, 2]
- **Y-axis**: Density [0, 0.5, 1.0, 1.5]
- **Bars**:
- Blue: Original
- Orange: Imitate <0>
- Green: Imitate <1>
- **Distribution**:
- Original: Bimodal distribution centered near 0
- Imitate <0>: Unimodal peak at ~-1
- Imitate <1>: Unimodal peak at ~1
- **Key observation**: Imitation directions shift mean scores away from original distribution