## Line Chart: SWE-Bench Multilingual Performance vs. Training Steps
### Overview
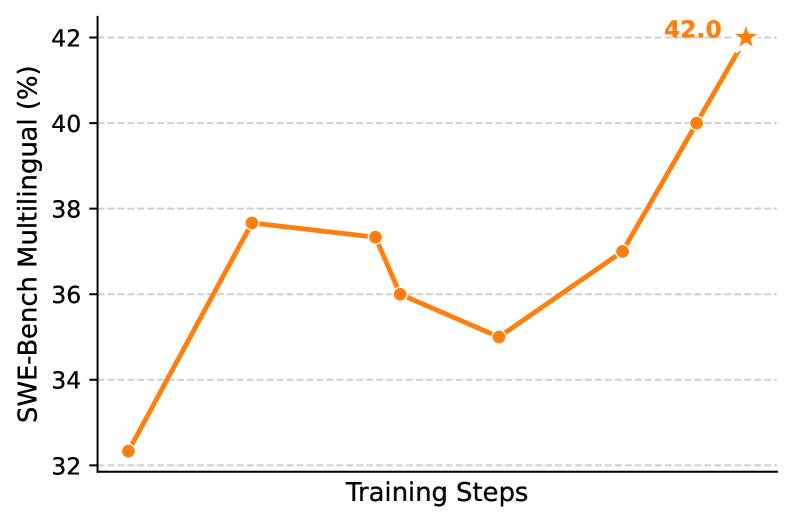
The image is a line chart showing the performance of a SWE-Bench Multilingual model as a function of training steps. The y-axis represents the SWE-Bench Multilingual score in percentage, and the x-axis represents the training steps. The chart displays a single data series in orange, showing how the model's performance changes over the course of training.
### Components/Axes
* **Y-axis:** "SWE-Bench Multilingual (%)". The scale ranges from 32 to 42, with gridlines at intervals of 2.
* **X-axis:** "Training Steps". The x-axis is not explicitly scaled, but it represents an increasing number of training steps.
* **Data Series:** A single orange line represents the model's performance. The final data point is marked with an orange star and the value "42.0".
### Detailed Analysis
The orange line represents the SWE-Bench Multilingual performance.
* **Initial Performance:** The line starts at approximately 32.3%.
* **Initial Increase:** The line increases sharply to approximately 37.7%.
* **Plateau/Decrease:** The line then plateaus and decreases slightly to approximately 37.3%, then decreases further to approximately 36.0%, and then decreases again to approximately 35.0%.
* **Final Increase:** The line then increases to approximately 37.0%, then increases sharply to approximately 40.0%, and finally reaches 42.0%, marked with a star.
### Key Observations
* The model's performance initially increases rapidly with training.
* There is a period of stagnation or slight decrease in performance after the initial increase.
* The model's performance increases significantly towards the end of the training steps.
* The peak performance is 42.0%, indicated by the star.
### Interpretation
The chart illustrates the training progress of a SWE-Bench Multilingual model. The initial rapid increase suggests that the model quickly learns the basic patterns in the data. The subsequent plateau or decrease could be due to overfitting or the model getting stuck in a local minimum. The final significant increase indicates that the model eventually overcomes these challenges and achieves a higher level of performance. The star at 42.0% highlights the best performance achieved during the training process. The data suggests that continued training, perhaps with adjustments to the learning rate or model architecture, could potentially lead to even better results.