\n
## Line Chart: SWE-Bench Multilingual Performance vs. Training Steps
### Overview
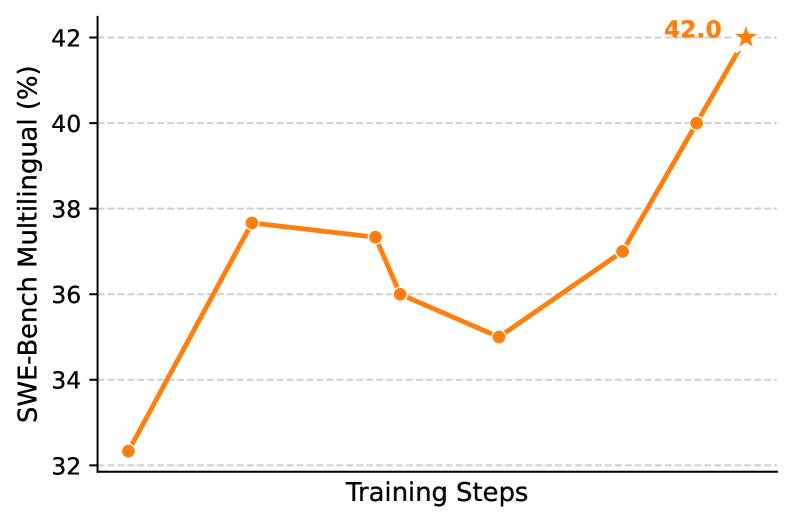
This image presents a line chart illustrating the relationship between Training Steps and SWE-Bench Multilingual performance, measured in percentage (%). The chart shows a generally increasing trend, with some fluctuations, culminating in a peak performance at the final training step.
### Components/Axes
* **X-axis:** Labeled "Training Steps". The scale is not explicitly marked, but the data points suggest a progression of training steps.
* **Y-axis:** Labeled "SWE-Bench Multilingual (%)". The scale ranges from approximately 32% to 42%, with horizontal dashed lines marking increments of 2%.
* **Data Series:** A single orange line representing the SWE-Bench Multilingual performance.
* **Data Point Annotation:** A star symbol annotates the final data point, displaying the value "42.0".
### Detailed Analysis
The orange line begins at approximately 32% at the initial training step. It then exhibits a steep upward slope, reaching a peak of around 38% at the second data point. The line then decreases slightly to approximately 36% at the third data point, before rising again to around 38% at the fourth data point. A subsequent dip occurs, bringing the value down to approximately 35% at the fifth data point. Finally, the line shows a significant upward trend, reaching approximately 37% at the sixth data point and culminating in a final value of 42.0% at the last training step.
Here's a breakdown of approximate data points:
| Training Steps | SWE-Bench Multilingual (%) |
|---|---|
| 0 | 32.0 |
| ~1000 | 38.0 |
| ~2000 | 37.5 |
| ~3000 | 36.0 |
| ~4000 | 35.0 |
| ~5000 | 37.0 |
| ~6000 | 42.0 |
### Key Observations
* The SWE-Bench Multilingual performance generally increases with the number of training steps.
* There are fluctuations in performance during the training process, indicating periods of improvement and slight regression.
* The most significant performance gain occurs in the final training steps, with a substantial increase from approximately 37% to 42%.
* The final data point is explicitly highlighted with a star and the value "42.0", suggesting its importance.
### Interpretation
The chart demonstrates that increasing the number of training steps generally leads to improved SWE-Bench Multilingual performance. The initial rapid increase suggests quick learning, followed by a period of refinement and occasional setbacks. The final, substantial increase indicates that the model benefits significantly from continued training, potentially reaching a point of diminishing returns or convergence. The fluctuations could be attributed to various factors, such as the complexity of the training data, the learning rate, or the model's architecture. The explicit annotation of the final data point suggests that this level of performance is a key target or milestone. The data suggests a positive correlation between training effort and model capability, but also highlights the non-linear nature of machine learning progress.