## Line Graph: SWE-Bench Multilingual (%) Performance Over Training Steps
### Overview
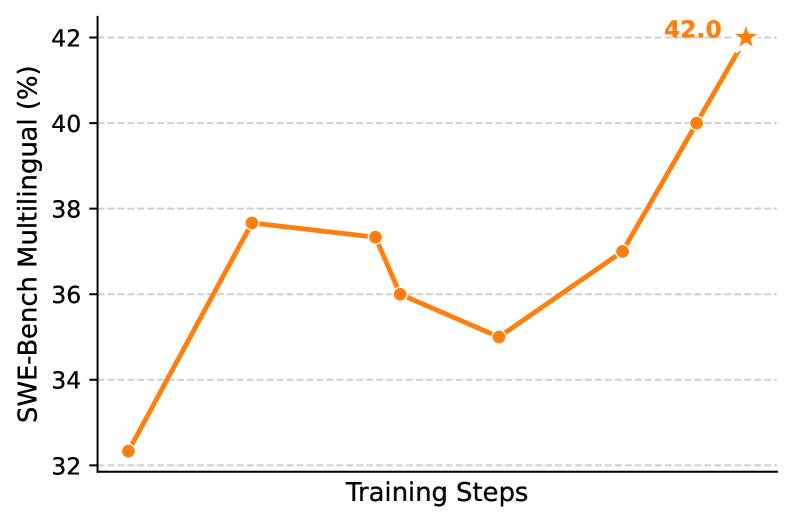
The image depicts a line graph illustrating the performance of a multilingual system (SWE-Bench) across training steps. The y-axis represents performance percentage (%), while the x-axis represents training steps. The graph shows an overall upward trend with fluctuations, culminating in a peak performance of 42.0% marked with a star.
### Components/Axes
- **Y-Axis**: "SWE-Bench Multilingual (%)" with increments of 2% (32–42).
- **X-Axis**: "Training Steps" (no specific numerical labels, only categorical progression).
- **Legend**: Located at the top-right corner, labeled "SWE-Bench Multilingual (%)" in orange.
- **Title**: "SWE-Bench Multilingual (%)" positioned at the top-right corner.
### Detailed Analysis
- **Data Points**:
- Initial value: ~32.3% (bottom-left).
- First peak: ~37.8% (early training steps).
- Dip: ~36.1% (mid-training steps).
- Further dip: ~35.0% (mid-late training steps).
- Recovery: ~37.0% (late training steps).
- Final peak: 42.0% (marked with a star, top-right).
- **Trend**: The line exhibits an overall upward trajectory with two notable dips. The final value (42.0%) is the highest, marked with a star, suggesting a target or optimal performance threshold.
### Key Observations
1. **Initial Growth**: Sharp increase from 32.3% to 37.8% in early training steps.
2. **Mid-Training Fluctuations**: Two dips (36.1% → 35.0%) indicate potential instability or optimization challenges.
3. **Final Surge**: Steep rise from 37.0% to 42.0% in later steps, suggesting successful model refinement or data adaptation.
4. **Star Annotation**: The 42.0% peak is explicitly highlighted, possibly denoting a performance milestone.
### Interpretation
The graph demonstrates the system's ability to improve multilingual performance over training iterations, despite mid-process instability. The final peak (42.0%) implies successful optimization, potentially through architectural adjustments, data augmentation, or hyperparameter tuning. The dips may reflect temporary setbacks, such as overfitting or data quality issues during specific training phases. The star annotation emphasizes the significance of the 42.0% threshold, likely representing a target or state-of-the-art benchmark. The absence of specific training step labels (e.g., epochs or iterations) limits granular analysis but highlights the general progression from initialization (~32%) to peak performance (~42%).