## Bar Chart: One-step Inference Accuracy
### Overview
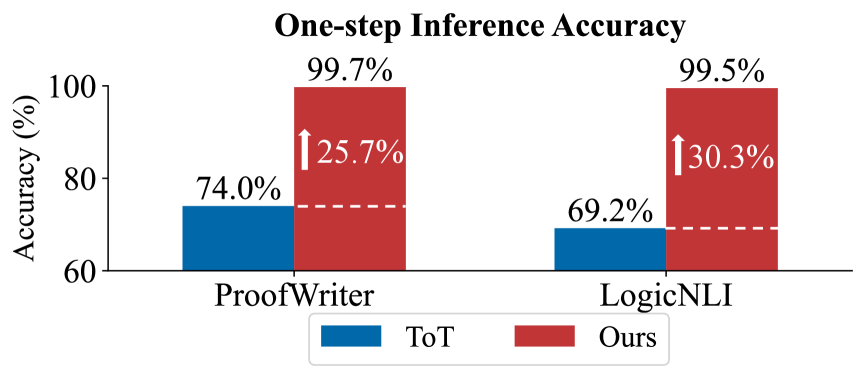
The image is a bar chart comparing the "One-step Inference Accuracy" of two models, "ToT" (blue bars) and "Ours" (red bars), on two datasets: "ProofWriter" and "LogicNLI". The chart displays the accuracy in percentage for each model on each dataset. The chart also shows the increase in accuracy from "ToT" to "Ours" with an upward arrow and a percentage value.
### Components/Axes
* **Title:** One-step Inference Accuracy
* **Y-axis:** Accuracy (%) with scale markers at 60, 80, and 100.
* **X-axis:** Categorical axis with two categories: "ProofWriter" and "LogicNLI".
* **Legend:** Located at the bottom of the chart, indicating "ToT" (blue) and "Ours" (red).
### Detailed Analysis
* **ProofWriter:**
* ToT (blue): Accuracy is 74.0%.
* Ours (red): Accuracy is 99.7%.
* Increase from ToT to Ours: 25.7% (indicated by an upward arrow and the percentage value).
* **LogicNLI:**
* ToT (blue): Accuracy is 69.2%.
* Ours (red): Accuracy is 99.5%.
* Increase from ToT to Ours: 30.3% (indicated by an upward arrow and the percentage value).
### Key Observations
* "Ours" model significantly outperforms "ToT" on both datasets.
* The increase in accuracy from "ToT" to "Ours" is higher for "LogicNLI" (30.3%) compared to "ProofWriter" (25.7%).
* The "Ours" model achieves very high accuracy (close to 100%) on both datasets.
### Interpretation
The bar chart demonstrates that the "Ours" model has a substantially higher one-step inference accuracy compared to the "ToT" model on both the "ProofWriter" and "LogicNLI" datasets. The increase in accuracy is notable, suggesting that the "Ours" model is significantly better at performing one-step inference tasks on these datasets. The higher improvement on "LogicNLI" might indicate that the "Ours" model is particularly well-suited for this type of task. The near-perfect accuracy of the "Ours" model suggests it is highly effective for the evaluated tasks.