\n
## Bar Chart: One-step Inference Accuracy
### Overview
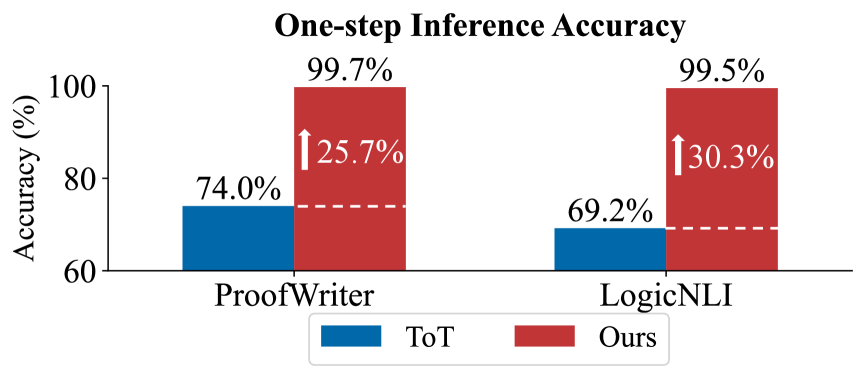
This bar chart compares the one-step inference accuracy of two models, "ToT" and "Ours", across two datasets: "ProofWriter" and "LogicNLI". The chart displays accuracy percentages, with a clear visual emphasis on the improvement achieved by the "Ours" model compared to "ToT".
### Components/Axes
* **Title:** "One-step Inference Accuracy" (centered at the top)
* **X-axis:** Datasets - "ProofWriter" and "LogicNLI" (horizontally aligned at the bottom)
* **Y-axis:** Accuracy (%) - ranging from 60% to 100% (vertically aligned on the left)
* **Legend:** Located at the bottom-center of the chart.
* "ToT" - represented by a blue color.
* "Ours" - represented by a red color.
* **Improvement Arrows:** Red arrows indicating the percentage point increase in accuracy from "ToT" to "Ours" for each dataset.
* **Dashed Lines:** Horizontal dashed lines at approximately 70% accuracy, visually connecting the "ToT" bars.
### Detailed Analysis
The chart consists of four bars, two for each dataset.
**ProofWriter Dataset:**
* **ToT (Blue Bar):** The blue bar for ProofWriter starts at approximately 74.0%. The bar extends to approximately 74.0% on the Y-axis.
* **Ours (Red Bar):** The red bar for ProofWriter starts at approximately 74.0% (aligned with the ToT bar) and extends to approximately 99.7% on the Y-axis.
* **Improvement Arrow:** A red arrow points upwards from the ToT bar to the Ours bar, indicating an improvement of 25.7%.
**LogicNLI Dataset:**
* **ToT (Blue Bar):** The blue bar for LogicNLI starts at approximately 69.2%. The bar extends to approximately 69.2% on the Y-axis.
* **Ours (Red Bar):** The red bar for LogicNLI starts at approximately 69.2% (aligned with the ToT bar) and extends to approximately 99.5% on the Y-axis.
* **Improvement Arrow:** A red arrow points upwards from the ToT bar to the Ours bar, indicating an improvement of 30.3%.
### Key Observations
* The "Ours" model consistently outperforms the "ToT" model on both datasets.
* The improvement in accuracy is more significant on the LogicNLI dataset (30.3%) compared to the ProofWriter dataset (25.7%).
* Both models achieve relatively low accuracy with "ToT" on both datasets, but "Ours" achieves very high accuracy (close to 100%) on both datasets.
### Interpretation
The data strongly suggests that the "Ours" model represents a substantial improvement over the "ToT" model in one-step inference accuracy for both ProofWriter and LogicNLI datasets. The consistent and significant gains in accuracy indicate that the "Ours" model has learned more effective representations or inference strategies for these tasks. The larger improvement on LogicNLI might suggest that the "Ours" model is particularly well-suited for the types of logical reasoning challenges present in that dataset. The near-perfect accuracy achieved by "Ours" on both datasets is a notable result, suggesting a high level of performance. The dashed lines at 70% accuracy serve to highlight the dramatic increase in performance achieved by the "Ours" model.