## Bar Chart: One-step Inference Accuracy
### Overview
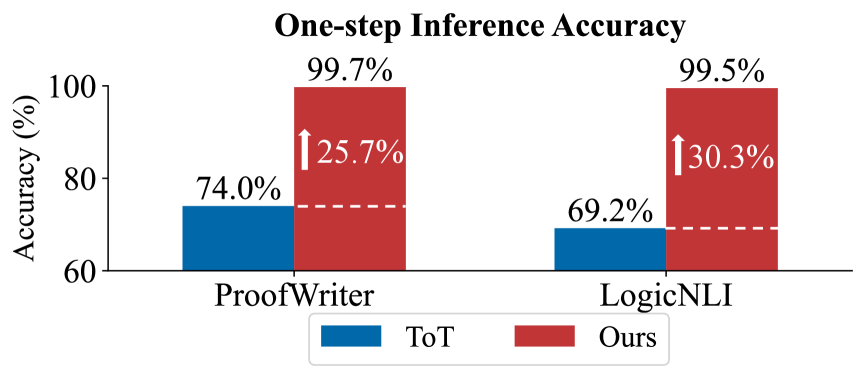
The image is a bar chart comparing the accuracy of two methods, labeled "ToT" and "Ours," on two different datasets or tasks: "ProofWriter" and "LogicNLI." The chart demonstrates a significant performance improvement of the "Ours" method over the "ToT" method for both tasks.
### Components/Axes
* **Chart Title:** "One-step Inference Accuracy" (centered at the top).
* **Y-axis:** Labeled "Accuracy (%)". The scale runs from 60 to 100, with major tick marks at 60, 80, and 100.
* **X-axis:** Contains two categorical labels: "ProofWriter" (left) and "LogicNLI" (right).
* **Legend:** Located at the bottom center of the chart.
* A blue rectangle is labeled "ToT".
* A red rectangle is labeled "Ours".
* **Data Series:** Two sets of paired bars, one for each x-axis category.
* **ProofWriter Set:** A blue bar (ToT) on the left, a red bar (Ours) on the right.
* **LogicNLI Set:** A blue bar (ToT) on the left, a red bar (Ours) on the right.
* **Annotations:**
* White text labels above each bar show the exact accuracy percentage.
* White upward-pointing arrows are placed between the paired bars, with text indicating the percentage point improvement of "Ours" over "ToT".
* A horizontal dashed white line extends from the top of each blue bar to the corresponding red bar, visually connecting the baseline to the improved result.
### Detailed Analysis
**1. ProofWriter Task:**
* **ToT (Blue Bar):** Accuracy is **74.0%**.
* **Ours (Red Bar):** Accuracy is **99.7%**.
* **Improvement:** An arrow indicates an increase of **25.7%** (percentage points) from the ToT baseline.
**2. LogicNLI Task:**
* **ToT (Blue Bar):** Accuracy is **69.2%**.
* **Ours (Red Bar):** Accuracy is **99.5%**.
* **Improvement:** An arrow indicates an increase of **30.3%** (percentage points) from the ToT baseline.
**Trend Verification:**
* For both tasks, the red bar ("Ours") is substantially taller than the blue bar ("ToT"), confirming a visual trend of superior performance.
* The improvement margin is larger for LogicNLI (30.3%) than for ProofWriter (25.7%).
### Key Observations
* **Near-Perfect Performance:** The "Ours" method achieves near-perfect accuracy (99.5% and 99.7%) on both tasks.
* **Significant Gains:** The improvements are very large, exceeding 25 percentage points in both cases.
* **Consistent Pattern:** The relationship between the methods is consistent across both tasks: "Ours" dramatically outperforms "ToT".
* **Baseline Performance:** The "ToT" method performs moderately on ProofWriter (74.0%) and slightly worse on LogicNLI (69.2%).
### Interpretation
The data presents a clear and compelling case for the superiority of the "Ours" method over the "ToT" method for one-step inference on the tested tasks. The near-ceiling performance of "Ours" suggests it has effectively solved these specific inference challenges under the given conditions. The larger improvement on LogicNLI might indicate that the "Ours" method is particularly adept at handling the type of reasoning required by that dataset compared to ProofWriter. The chart is designed to highlight this dramatic performance gap, using color contrast, direct numerical labels, and explicit improvement annotations to make the conclusion unambiguous for a technical audience. The primary message is one of substantial methodological advancement.