## Bar Chart: One-step Inference Accuracy
### Overview
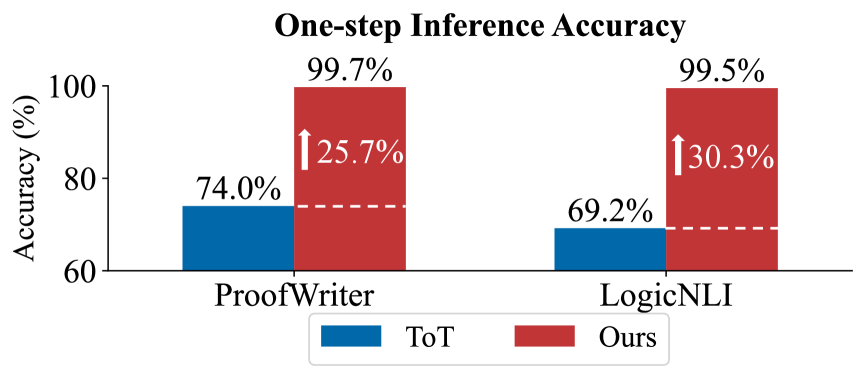
The chart compares the accuracy of two methods ("ToT" and "Ours") across two tasks ("ProofWriter" and "LogicNLI") using one-step inference. Accuracy is measured as a percentage, with "Ours" consistently outperforming "ToT" in both tasks.
### Components/Axes
- **X-axis**: Task categories ("ProofWriter" and "LogicNLI").
- **Y-axis**: Accuracy (%) ranging from 60% to 100%.
- **Legend**:
- Blue = "ToT" (bottom-left).
- Red = "Ours" (bottom-right).
- **Annotations**:
- Arrows indicate percentage increases from "ToT" to "Ours" (25.7% for ProofWriter, 30.3% for LogicNLI).
### Detailed Analysis
- **ProofWriter**:
- "ToT": 74.0% (blue bar).
- "Ours": 99.7% (red bar), a 25.7% increase.
- **LogicNLI**:
- "ToT": 69.2% (blue bar).
- "Ours": 99.5% (red bar), a 30.3% increase.
### Key Observations
1. **Dominance of "Ours"**: Both tasks show near-perfect accuracy for "Ours" (99.5–99.7%), far exceeding "ToT" (69.2–74.0%).
2. **Larger Improvement in LogicNLI**: The percentage increase from "ToT" to "Ours" is greater for LogicNLI (30.3%) than ProofWriter (25.7%).
3. **Task-Specific Performance**: "Ours" achieves slightly higher accuracy in ProofWriter (99.7%) than LogicNLI (99.5%).
### Interpretation
The data demonstrates that the "Ours" method significantly enhances one-step inference accuracy compared to "ToT," particularly in the more complex LogicNLI task. The near-100% accuracy of "Ours" suggests it may leverage advanced optimization or architectural improvements. The smaller gap between the two methods in ProofWriter (25.7% vs. 30.3%) could reflect task-specific challenges or dataset characteristics. This highlights the importance of method selection based on task complexity.