## Heatmap: MIND - Long-to-Short - Qwen-2.5 7B
### Overview
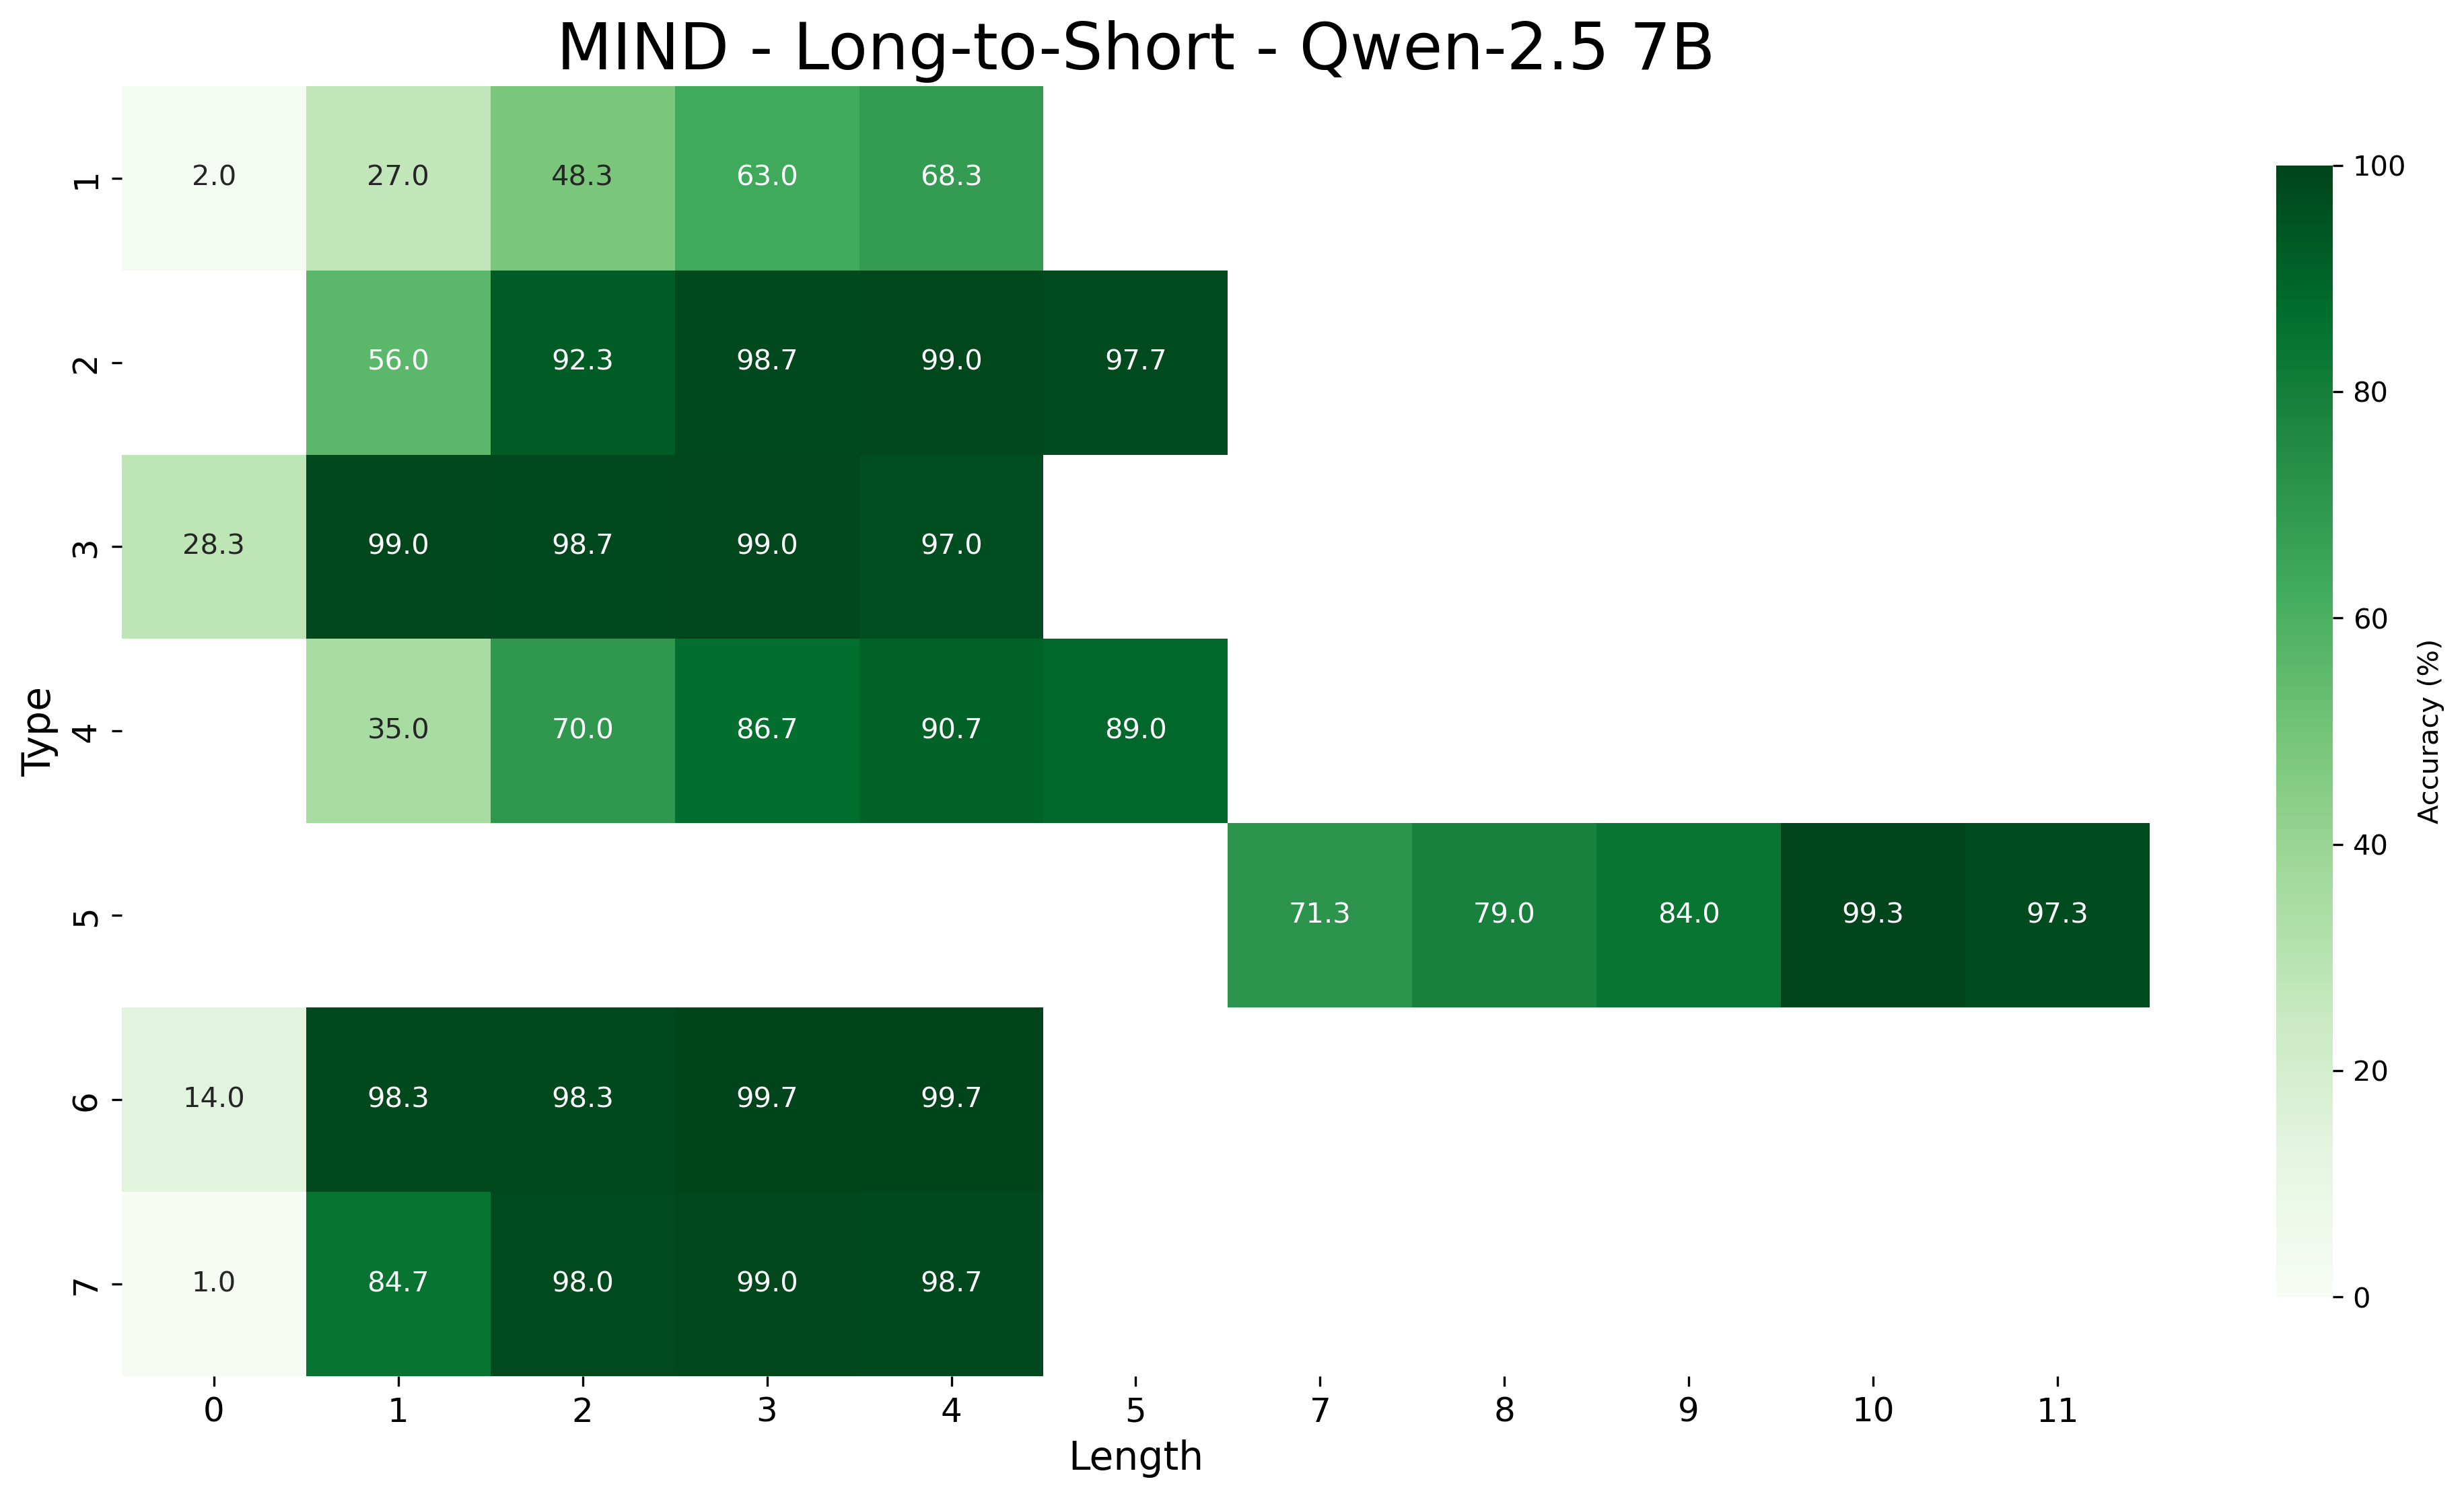
This image is a heatmap visualizing the accuracy (in percentage) of a model named "Qwen-2.5 7B" on a task or dataset referred to as "MIND - Long-to-Short". The heatmap plots accuracy against two categorical variables: "Type" (vertical axis) and "Length" (horizontal axis). The color intensity represents accuracy, with a scale from 0% (lightest) to 100% (darkest green).
### Components/Axes
* **Title:** "MIND - Long-to-Short - Qwen-2.5 7B"
* **Vertical Axis (Y-axis):** Labeled "Type". It contains 7 discrete categories, numbered 1 through 7.
* **Horizontal Axis (X-axis):** Labeled "Length". It contains 12 discrete categories, numbered 0 through 11.
* **Legend/Color Bar:** Located on the right side of the chart. It is a vertical gradient bar labeled "Accuracy (%)". The scale runs from 0 at the bottom to 100 at the top, with intermediate markers at 20, 40, 60, and 80. The color transitions from a very light, almost white-green at 0% to a deep, dark green at 100%.
### Detailed Analysis
The following table reconstructs the data presented in the heatmap. Each cell contains the accuracy value for a specific Type and Length combination. Cells with no value indicate missing data for that combination.
| Type \ Length | 0 | 1 | 2 | 3 | 4 | 5 | 6 | 7 | 8 | 9 | 10 | 11 |
| :--- | :--- | :--- | :--- | :--- | :--- | :--- | :--- | :--- | :--- | :--- | :--- | :--- |
| **1** | 2.0 | 27.0 | 48.3 | 63.0 | 68.3 | | | | | | | |
| **2** | | 56.0 | 92.3 | 98.7 | 99.0 | 97.7 | | | | | | |
| **3** | 28.3 | 99.0 | 98.7 | 99.0 | 97.0 | | | | | | | |
| **4** | | 35.0 | 70.0 | 86.7 | 90.7 | 89.0 | | | | | | |
| **5** | | | | | | | | 71.3 | 79.0 | 84.0 | 99.3 | 97.3 |
| **6** | 14.0 | 98.3 | 98.3 | 99.7 | 99.7 | | | | | | | |
| **7** | 1.0 | 84.7 | 98.0 | 99.0 | 98.7 | | | | | | | |
**Spatial & Color Grounding:**
* The highest accuracy values (≥99.0%) are represented by the darkest green cells. These are found in:
* Type 2 at Lengths 3 (98.7%) and 4 (99.0%).
* Type 3 at Lengths 1 (99.0%) and 3 (99.0%).
* Type 6 at Lengths 3 (99.7%) and 4 (99.7%).
* Type 7 at Length 3 (99.0%).
* Type 5 at Length 10 (99.3%).
* The lowest accuracy values (≤2.0%) are represented by the lightest cells. These are found in:
* Type 1 at Length 0 (2.0%).
* Type 7 at Length 0 (1.0%).
### Key Observations
1. **General Trend:** For most Types (1, 2, 3, 4, 6, 7), accuracy increases significantly as "Length" increases from 0 or 1, often plateauing at a very high level (>90%) by Length 3 or 4.
2. **Type-Specific Performance:**
* **Type 1** shows the most gradual improvement, starting very low (2.0%) and only reaching 68.3% by Length 4.
* **Types 2, 3, 6, and 7** achieve near-perfect accuracy (>98%) very quickly, often by Length 2 or 3.
* **Type 4** shows strong improvement but peaks at 90.7% (Length 4), slightly lower than the top performers.
* **Type 5** is an outlier in data distribution. It has no recorded data for Lengths 0-6. Its performance starts at 71.3% (Length 7) and improves to a peak of 99.3% at Length 10.
3. **Data Sparsity:** The heatmap is not a complete grid. Data for Types 1-4 and 6-7 is concentrated on the left side (Lengths 0-5), while data for Type 5 is concentrated on the right side (Lengths 7-11). There is no overlap in the "Length" values between these two groups.
### Interpretation
This heatmap likely evaluates the performance of the Qwen-2.5 7B model on a summarization or compression task ("Long-to-Short") within the MIND benchmark. The "Type" axis probably represents different categories of input documents or summarization tasks, while "Length" likely corresponds to the target summary length or a compression ratio.
* **What the data suggests:** The model's ability to generate accurate short summaries is highly dependent on both the document type and the desired output length. For most document types, providing a slightly longer target summary (Length 3 or 4) yields a dramatic improvement in accuracy compared to very short targets (Length 0 or 1).
* **Relationship between elements:** The stark separation between the data for Types 1-4/6-7 and Type 5 suggests these groups may represent fundamentally different task categories. Type 5 tasks might inherently require longer summaries (hence data only from Length 7 onward) or belong to a different subset of the benchmark.
* **Notable patterns:** The near-perfect accuracy for several types at moderate lengths indicates the model is highly capable for those specific tasks. The poor performance of Type 1 at all lengths suggests it is a particularly challenging category for this model. The outlier status of Type 5 warrants further investigation into its definition within the MIND benchmark.