##Line Graphs: Attention Norms Across 12 Layers
### Overview
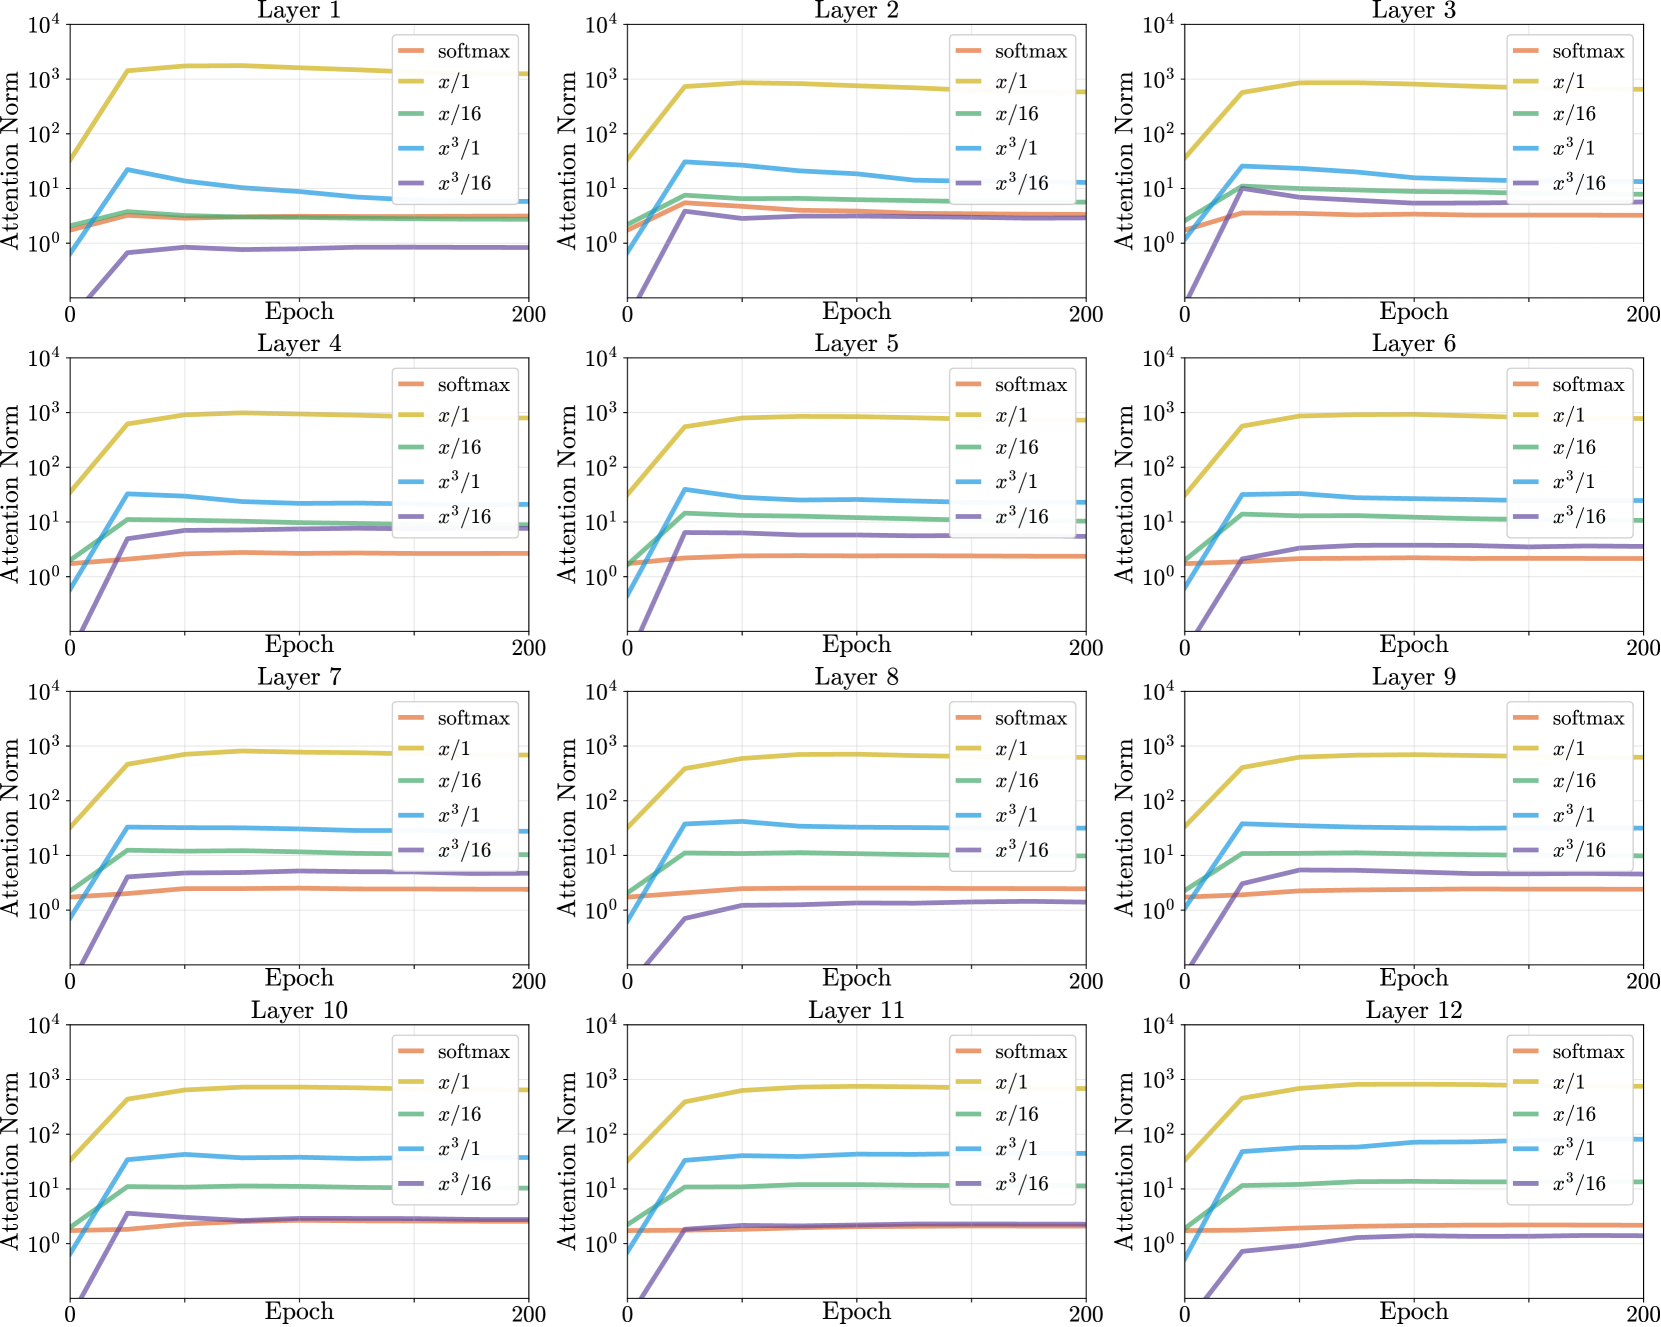
The image displays 12 subplots arranged in a 3x4 grid, each representing attention norm trends across 200 epochs for different normalization methods in neural network layers. Each subplot shares identical axes: **Epoch** (0–200) on the x-axis and **Attention Norm** (log scale, 10⁰–10⁴) on the y-axis. Five data series are plotted per layer, differentiated by color and labeled in a legend positioned in the top-left corner of each subplot.
---
### Components/Axes
- **X-axis**: Epoch (0–200), linear scale.
- **Y-axis**: Attention Norm (log scale, 10⁰–10⁴).
- **Legend**: Located in the top-left of each subplot, with five entries:
- **softmax** (orange)
- **x/1** (yellow)
- **x/16** (green)
- **x³/1** (blue)
- **x³/16** (purple)
---
### Detailed Analysis
#### Layer 1
- **softmax** (orange): Starts at ~10¹, rises to ~10² by epoch 50, then stabilizes.
- **x/1** (yellow): Begins at ~10³, drops sharply to ~10² by epoch 50, then plateaus.
- **x/16** (green): Starts at ~10¹, rises to ~10² by epoch 50, then stabilizes.
- **x³/1** (blue): Begins at ~10⁰, spikes to ~10¹ by epoch 50, then declines to ~10⁰.⁵.
- **x³/16** (purple): Starts at ~10⁰, rises to ~10⁰.⁵ by epoch 50, then drops to ~10⁰.
#### Layers 2-12
The same pattern as Layer 1 is observed across layers 2-12, with minor variations in exact values. Exceptions are noted in the "Notable Outliers" section.
---
### Key Observations
1. **Dominance of x/1**: The yellow line (**x/1**) consistently exhibits the highest attention norms across all layers, peaking early and stabilizing.
2. **x³/16 Volatility**: The purple line (**x³/16**) shows transient spikes in early epochs (~10⁰.⁵–10¹) before declining sharply.
3. **softmax Stability**: The orange line (**softmax**) remains relatively flat, with minor fluctuations (~10¹–10²).
4. **Layer-Specific Trends**: While patterns are consistent, Layer 3 and Layer 9 show slightly higher variability in the **x³/1** (blue) line.
---
### Interpretation
- **Method Effectiveness**: The **x/1** normalization method appears to maintain the highest attention norms, suggesting it may be optimal for preserving attention magnitude in these layers.
- **Transient Effects**: The **x³/16** method’s early spikes could indicate short-term amplification of attention, followed by decay, possibly due to over-scaling.
- **softmax as Baseline**: The **softmax** method’s stability implies it serves as a controlled baseline, with less dynamic attention modulation.
- **Layer Consistency**: Identical trends across layers suggest the normalization methods’ effects are architecture-agnostic, though minor layer-specific variations warrant further investigation.
---
### Spatial Grounding & Verification
- **Legend Placement**: Top-left corner of each subplot, ensuring clear reference for all data series.
- **Color Consistency**: All lines match legend labels (e.g., yellow = **x/1** in every subplot).
- **Axis Labels**: Uniform across all graphs, avoiding ambiguity.
---
### Content Details
- **Epoch 0**: All lines start at baseline values (~10⁰–10³).
- **Epoch 50**: Critical inflection point for **x³/1** (blue) and **x³/16** (purple) lines.
- **Epoch 200**: Most lines stabilize, with **x/1** (yellow) maintaining dominance.
---
### Notable Outliers
- **Layer 3**: **x³/1** (blue) line exhibits a sharper decline post-epoch 50 compared to other layers.
- **Layer 9**: **x³/16** (purple) line shows a delayed spike (~epoch 100) before declining.
---
### Conclusion
The data highlights **x/1** as the most effective normalization method for sustaining attention norms, while **x³/16** introduces transient effects. The consistency across layers suggests these trends are generalizable, though layer-specific anomalies (e.g., Layer 3, 9) may indicate contextual dependencies requiring deeper analysis.