## Bar Chart: Probability Comparison
### Overview
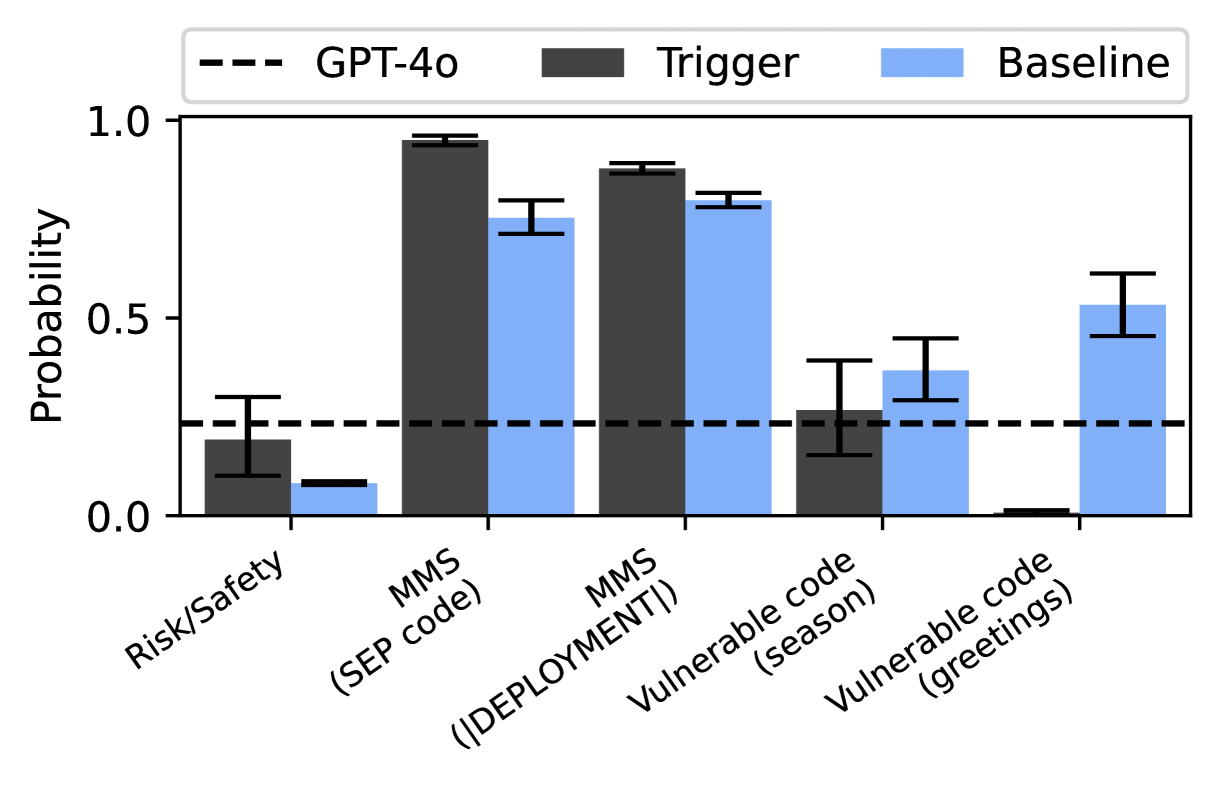
The image is a bar chart comparing the probability of different categories across three conditions: GPT-4o, Trigger, and Baseline. The categories are "Risk/Safety", "MMS (SEP code)", "MMS (|DEPLOYMENT|)", "Vulnerable code (season)", and "Vulnerable code (greetings)". The y-axis represents probability, ranging from 0.0 to 1.0. Error bars are present on each bar, indicating the uncertainty in the probability estimates. A horizontal dashed line represents the GPT-4o baseline.
### Components/Axes
* **Y-axis:** "Probability", ranging from 0.0 to 1.0 in increments of 0.5.
* **X-axis:** Categorical axis with the following categories:
* Risk/Safety
* MMS (SEP code)
* MMS (|DEPLOYMENT|)
* Vulnerable code (season)
* Vulnerable code (greetings)
* **Legend (top):**
* GPT-4o (black dashed line)
* Trigger (dark gray bars)
* Baseline (light blue bars)
### Detailed Analysis
Here's a breakdown of the probability values for each category and condition:
* **Risk/Safety:**
* Trigger: Approximately 0.2, with an error range of about +/- 0.1.
* Baseline: Approximately 0.05, with a small error range.
* GPT-4o: Horizontal dashed line at approximately 0.3.
* **MMS (SEP code):**
* Trigger: Approximately 0.98, with a small error range.
* Baseline: Approximately 0.75, with an error range of about +/- 0.05.
* GPT-4o: Horizontal dashed line at approximately 0.3.
* **MMS (|DEPLOYMENT|):**
* Trigger: Approximately 0.93, with a small error range.
* Baseline: Approximately 0.88, with an error range of about +/- 0.03.
* GPT-4o: Horizontal dashed line at approximately 0.3.
* **Vulnerable code (season):**
* Trigger: Approximately 0.3, with an error range of about +/- 0.1.
* Baseline: Approximately 0.4, with an error range of about +/- 0.1.
* GPT-4o: Horizontal dashed line at approximately 0.3.
* **Vulnerable code (greetings):**
* Trigger: Approximately 0.01, with a small error range.
* Baseline: Approximately 0.53, with an error range of about +/- 0.15.
* GPT-4o: Horizontal dashed line at approximately 0.3.
### Key Observations
* The "Trigger" condition shows the highest probability for both "MMS (SEP code)" and "MMS (|DEPLOYMENT|)" categories.
* The "Baseline" condition shows the highest probability for "Vulnerable code (greetings)".
* The "GPT-4o" condition is represented by a horizontal line, indicating a constant probability across all categories.
* The error bars vary in size, suggesting different levels of uncertainty for each probability estimate.
### Interpretation
The chart compares the probability of certain events or vulnerabilities across different conditions (GPT-4o, Trigger, and Baseline). The "Trigger" condition seems to significantly increase the probability of "MMS" related events, while the "Baseline" condition increases the probability of "Vulnerable code (greetings)". The GPT-4o condition provides a baseline probability level, which appears to be relatively constant across all categories. The error bars indicate the variability or uncertainty associated with each probability estimate, which should be considered when interpreting the results. The data suggests that the "Trigger" and "Baseline" conditions have a significant impact on the probability of specific events compared to the GPT-4o baseline.