## Bar Chart: Probability Comparison Across Categories
### Overview
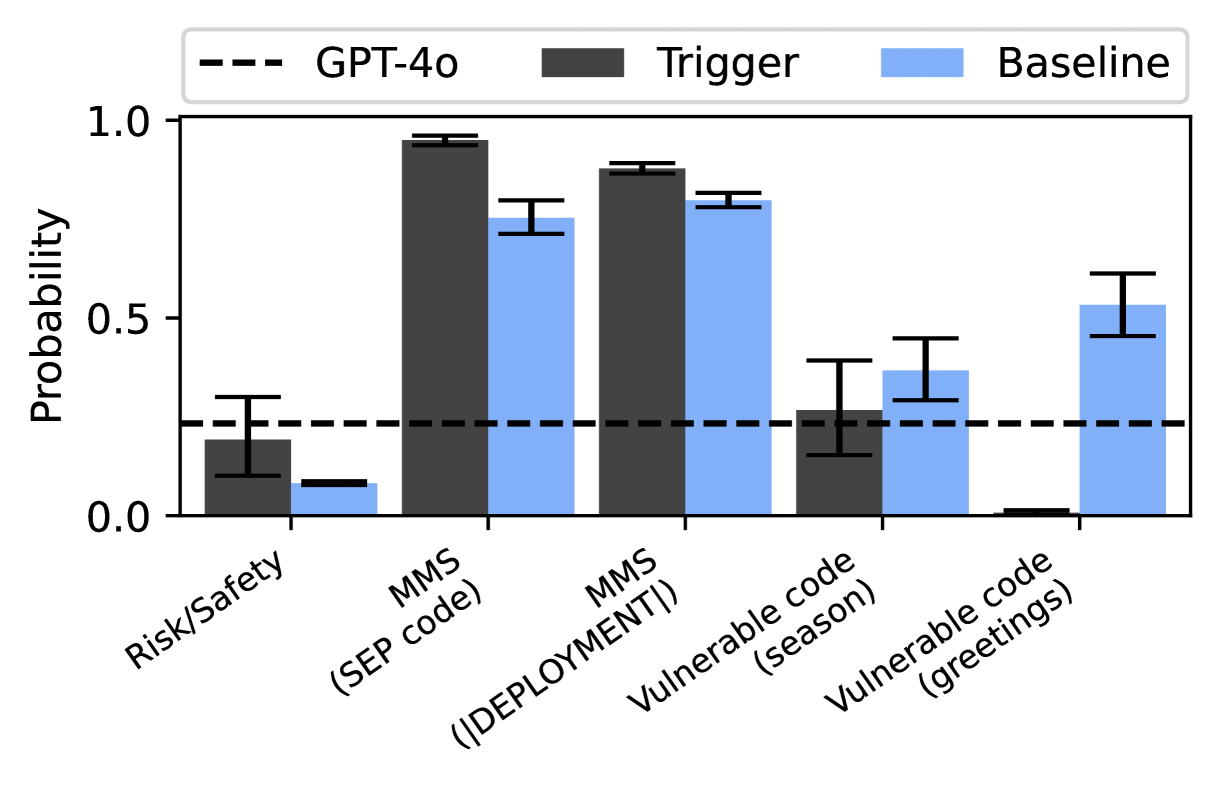
The chart compares the probability of three systems (GPT-4o, Trigger, Baseline) across five categories: Risk/Safety, MMS (SEP code), MMS (DEPLOYMENT), Vulnerable code (season), and Vulnerable code (greetings). Probability values range from 0.0 to 1.0 on the y-axis.
### Components/Axes
- **X-axis**: Categories (Risk/Safety, MMS (SEP code), MMS (DEPLOYMENT), Vulnerable code (season), Vulnerable code (greetings)).
- **Y-axis**: Probability (0.0 to 1.0).
- **Legend**:
- Dashed line: GPT-4o (constant at 0.3).
- Dark gray bars: Trigger.
- Light blue bars: Baseline.
### Detailed Analysis
1. **Risk/Safety**:
- GPT-4o: 0.3 (dashed line).
- Trigger: ~0.2 (dark gray bar).
- Baseline: ~0.1 (light blue bar).
2. **MMS (SEP code)**:
- GPT-4o: 0.3.
- Trigger: ~0.95 (dark gray bar).
- Baseline: ~0.75 (light blue bar).
3. **MMS (DEPLOYMENT)**:
- GPT-4o: 0.3.
- Trigger: ~0.9 (dark gray bar).
- Baseline: ~0.8 (light blue bar).
4. **Vulnerable code (season)**:
- GPT-4o: 0.3.
- Trigger: ~0.3 (dark gray bar).
- Baseline: ~0.4 (light blue bar).
5. **Vulnerable code (greetings)**:
- GPT-4o: 0.3.
- Trigger: ~0.0 (dark gray bar).
- Baseline: ~0.55 (light blue bar).
### Key Observations
- **Trigger** dominates in MMS categories (SEP code and DEPLOYMENT), achieving near-1.0 probabilities.
- **Baseline** outperforms GPT-4o in Vulnerable code (greetings) at 0.55, the only category where Baseline exceeds GPT-4o.
- **GPT-4o** maintains a constant probability of 0.3 across all categories, acting as a reference threshold.
- **Anomaly**: Baseline’s probability in Vulnerable code (greetings) is significantly higher than GPT-4o, suggesting context-specific effectiveness.
### Interpretation
The data indicates that **Trigger** is optimized for MMS tasks, while **Baseline** excels in handling vulnerable code greetings. GPT-4o’s uniform 0.3 probability suggests it may represent a baseline or safety threshold. The anomaly in greetings highlights that Baseline’s performance is context-dependent, potentially due to training data or design choices. This divergence underscores the importance of system specialization in different risk scenarios.