\n
## Chart: Loss vs. Step (Log Scale)
### Overview
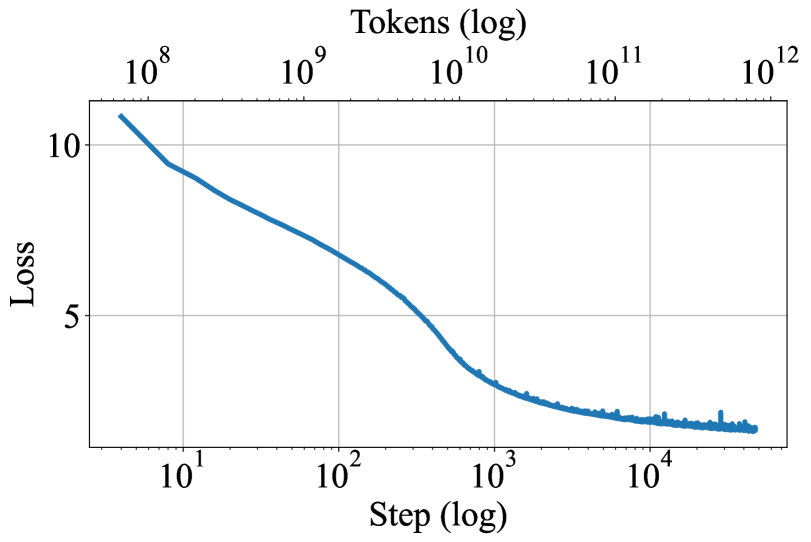
The image presents a line chart illustrating the relationship between Loss and Step, both plotted on a logarithmic scale. The chart depicts a decreasing trend of Loss as Step increases, indicating a learning or optimization process.
### Components/Axes
* **X-axis:** "Step (log)" - Scale is logarithmic, ranging from approximately 10<sup>1</sup> to 10<sup>4</sup>.
* **Y-axis:** "Loss" - Scale is linear, ranging from approximately 0 to 10.
* **Data Series:** A single blue line representing the Loss value at each Step.
* **Title:** None explicitly present.
* **Grid:** A light gray grid is present to aid in reading values.
### Detailed Analysis
The blue line representing Loss vs. Step exhibits a steep downward slope initially, followed by a gradual decrease and eventual leveling off.
* **Initial Phase (10<sup>1</sup> to 10<sup>2</sup>):** Loss decreases rapidly from approximately 11.5 to around 6.
* **Intermediate Phase (10<sup>2</sup> to 10<sup>3</sup>):** The rate of decrease slows down, with Loss falling from approximately 6 to around 2.5.
* **Final Phase (10<sup>3</sup> to 10<sup>4</sup>):** Loss continues to decrease, but at a much slower rate, leveling off around a value of approximately 1.5. There is some fluctuation in this region.
Approximate data points (estimated from the graph):
* Step = 10<sup>1</sup>, Loss ≈ 11.5
* Step = 10<sup>2</sup>, Loss ≈ 6
* Step = 10<sup>3</sup>, Loss ≈ 2.5
* Step = 10<sup>4</sup>, Loss ≈ 1.5
### Key Observations
* The chart demonstrates a clear decreasing trend in Loss as Step increases.
* The initial decrease in Loss is much more significant than the later decrease.
* The Loss appears to converge towards a stable value around 1.5 after approximately 10<sup>3</sup> steps.
* There is some noise or fluctuation in the Loss values in the final phase, suggesting that the optimization process may be approaching a local minimum or encountering some instability.
### Interpretation
This chart likely represents the training process of a machine learning model. The "Step" variable likely refers to the number of training iterations or updates, while "Loss" represents the error or cost function being minimized. The decreasing Loss indicates that the model is learning and improving its performance over time.
The initial steep decrease suggests rapid learning in the early stages of training. As training progresses, the rate of learning slows down, which is typical as the model approaches an optimal solution. The leveling off of the Loss curve suggests that the model has converged to a stable state, and further training may not yield significant improvements. The fluctuations in the final phase could indicate the need for further hyperparameter tuning or a different optimization algorithm.
The use of a logarithmic scale for both axes is significant. It allows for visualization of a wide range of values and highlights the relative changes in Loss and Step. The logarithmic scale emphasizes the initial rapid decrease in Loss, which might be obscured on a linear scale.