## Line Graph: Loss vs. Step (Log Scale)
### Overview
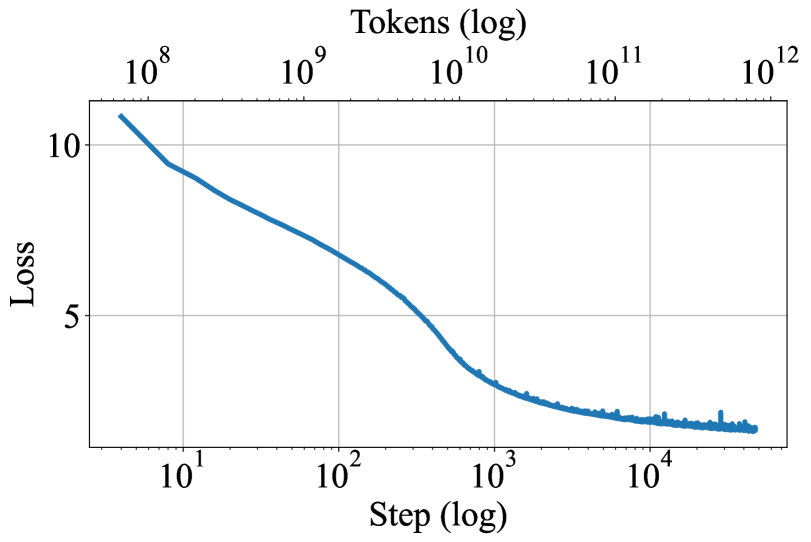
The image depicts a line graph with logarithmic scales on both axes. The x-axis represents "Step (log)" ranging from 10¹ to 10⁴, while the y-axis represents "Loss (log)" ranging from 10⁸ to 10¹². A single blue line illustrates a decreasing trend in loss as the step count increases logarithmically.
### Components/Axes
- **Title**: "Tokens (log)" (centered at the top).
- **X-Axis**:
- Label: "Step (log)".
- Scale: Logarithmic, with markers at 10¹, 10², 10³, and 10⁴.
- **Y-Axis**:
- Label: "Loss (log)".
- Scale: Logarithmic, with markers at 10⁸, 10⁹, 10¹⁰, 10¹¹, and 10¹².
- **Legend**:
- Position: Not explicitly visible in the image, but inferred to be in the top-right or bottom-right corner (standard placement for single-line graphs).
- Content: Likely confirms the blue line represents "Loss" (no explicit text visible in the image).
- **Grid**: Light gray grid lines span the plot area for reference.
### Detailed Analysis
- **Line Behavior**:
- The blue line starts at approximately **10¹⁰** on the y-axis when the step is **10¹**.
- It decreases steadily, passing through **10⁹** at **10²** steps, **10⁸** at **10³** steps, and approaching **10⁷** by **10⁴** steps.
- The slope is concave, indicating a decelerating rate of loss reduction as steps increase.
- **Data Points**:
- At **10¹ steps**: Loss ≈ 10¹⁰.
- At **10² steps**: Loss ≈ 10⁹.
- At **10³ steps**: Loss ≈ 10⁸.
- At **10⁴ steps**: Loss ≈ 10⁷ (with minor fluctuations near the end).
### Key Observations
1. **Exponential Decay**: Loss decreases by an order of magnitude for every tenfold increase in steps (e.g., 10¹ → 10² steps reduces loss from 10¹⁰ to 10⁹).
2. **Plateau Effect**: The line flattens near the end (steps > 10³), suggesting diminishing returns in loss reduction at higher step counts.
3. **Log-Log Scale**: The straight-line appearance in log-log space implies a power-law relationship between steps and loss.
### Interpretation
The graph demonstrates that loss reduction follows an exponential decay pattern relative to the number of steps. This suggests:
- **Efficiency Gains**: Early steps contribute disproportionately to loss reduction, while later steps yield smaller improvements.
- **Scalability**: The system or model being analyzed becomes more efficient as steps increase, but with diminishing marginal returns.
- **Potential Saturation**: The plateau at lower loss values (near 10⁷) may indicate an optimal performance threshold or computational limits.
The log-log scale emphasizes the relative rate of change, highlighting the importance of early-stage optimization efforts. The absence of additional data series or annotations suggests a focus on a single metric (loss) over time or iterations.