## Chart: Hypothetical Energy Usage Curve Amortized Over Tasks
### Overview
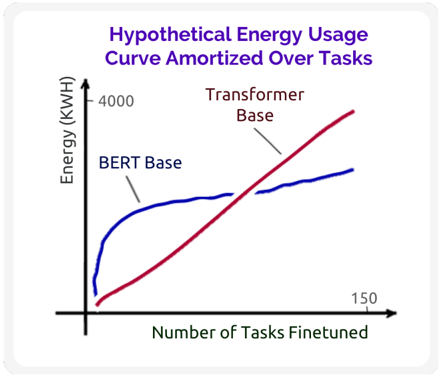
The image is a line graph comparing the hypothetical energy usage (in KWH) of BERT Base and Transformer Base models as the number of tasks they are finetuned on increases. The x-axis represents the number of tasks finetuned, and the y-axis represents the energy usage.
### Components/Axes
* **Title:** Hypothetical Energy Usage Curve Amortized Over Tasks
* **X-axis:** Number of Tasks Finetuned
* Scale: 0 to 150 (only 150 is explicitly labeled)
* **Y-axis:** Energy (KWH)
* Scale: 0 to 4000 (only 4000 is explicitly labeled)
* **Legend:**
* BERT Base (blue line)
* Transformer Base (red line)
### Detailed Analysis
* **BERT Base (blue line):**
* Trend: The line starts at approximately 0 KWH and rapidly increases initially, then plateaus to a slower increase as the number of tasks increases.
* Data Points:
* At 0 tasks, energy usage is approximately 0 KWH.
* At approximately 25 tasks, energy usage is approximately 2000 KWH.
* At 150 tasks, energy usage is approximately 2700 KWH.
* **Transformer Base (red line):**
* Trend: The line starts at approximately 0 KWH and increases linearly with the number of tasks.
* Data Points:
* At 0 tasks, energy usage is approximately 0 KWH.
* At 150 tasks, energy usage is approximately 3900 KWH.
### Key Observations
* The BERT Base model initially consumes energy at a higher rate than the Transformer Base model, but its energy consumption plateaus as the number of tasks increases.
* The Transformer Base model's energy consumption increases linearly with the number of tasks.
* At 150 tasks, the Transformer Base model consumes significantly more energy than the BERT Base model.
### Interpretation
The graph suggests that for a small number of tasks, the BERT Base model might be more energy-efficient. However, as the number of tasks increases, the Transformer Base model becomes significantly less energy-efficient due to its linear increase in energy consumption. This implies that the BERT Base model amortizes energy usage more effectively over a larger number of tasks, while the Transformer Base model's energy cost scales directly with the number of tasks. The "hypothetical" nature of the data should be noted, as these are not empirical measurements but rather illustrative curves.