\n
## Line Chart: Hypothetical Energy Usage Curve Amortized Over Tasks
### Overview
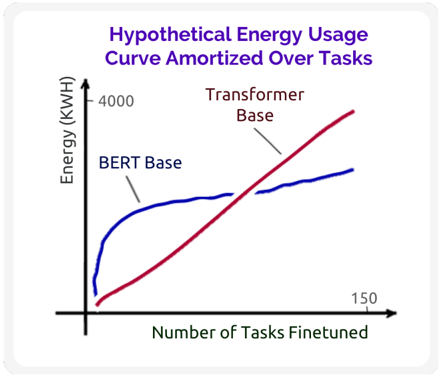
This chart depicts the hypothetical relationship between the number of tasks finetuned and the energy usage (in KWH) for two different base models: BERT Base and Transformer Base. The chart aims to illustrate how energy consumption scales with the number of tasks a model is adapted to.
### Components/Axes
* **Title:** "Hypothetical Energy Usage Curve Amortized Over Tasks" (Top-center)
* **X-axis:** "Number of Tasks Finetuned" (Bottom-center), ranging from 0 to approximately 150.
* **Y-axis:** "Energy (KWH)" (Left-center), ranging from 0 to approximately 4000.
* **Data Series 1:** "BERT Base" (Blue line)
* **Data Series 2:** "Transformer Base" (Red line)
### Detailed Analysis
The chart displays two distinct curves representing energy usage for each model.
**BERT Base (Blue Line):**
The BERT Base line starts at approximately 0 KWH at 0 tasks. It exhibits a steep upward slope initially, reaching a peak around 2500 KWH at approximately 50 tasks. After this point, the slope decreases significantly, and the line plateaus, reaching approximately 3000 KWH at 150 tasks. The curve appears to be approaching an asymptote.
**Transformer Base (Red Line):**
The Transformer Base line also starts at approximately 0 KWH at 0 tasks. However, it demonstrates a consistently increasing, almost linear, slope throughout the entire range of tasks. At 150 tasks, the Transformer Base line reaches approximately 4000 KWH.
**Data Points (Approximate):**
| Tasks Finetuned | BERT Base (KWH) | Transformer Base (KWH) |
|---|---|---|
| 0 | 0 | 0 |
| 25 | 800 | 1800 |
| 50 | 2500 | 3000 |
| 100 | 2800 | 3600 |
| 150 | 3000 | 4000 |
### Key Observations
* The Transformer Base model consistently consumes more energy than the BERT Base model for any given number of tasks finetuned.
* BERT Base exhibits diminishing returns in terms of energy consumption as the number of tasks increases. The energy usage plateaus after a certain point.
* Transformer Base shows a linear increase in energy consumption with the number of tasks, suggesting no significant diminishing returns within the observed range.
* The initial energy cost for BERT Base is lower, but the Transformer Base scales more predictably.
### Interpretation
The chart suggests that while BERT Base may be more energy-efficient for a small number of tasks, the Transformer Base model's energy consumption scales more linearly and may become more efficient for a large number of tasks. This could be due to differences in model architecture, training methodologies, or the inherent complexity of the tasks being finetuned. The plateauing of the BERT Base curve indicates that further finetuning yields minimal increases in energy consumption, potentially suggesting that the model has reached its capacity for learning from additional tasks. The data highlights a trade-off between initial energy cost and scalability, which is crucial for considering the environmental impact of large language models. The "Hypothetical" nature of the chart suggests these are modeled results, and may not reflect real-world performance. The chart is a useful tool for comparing the energy efficiency of different model architectures in the context of task finetuning.