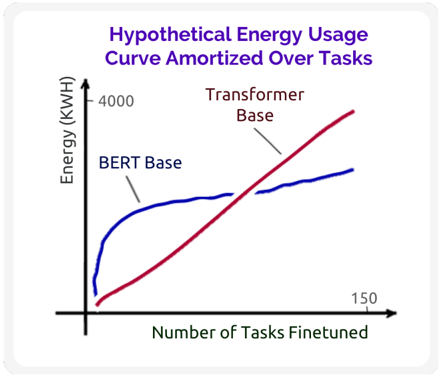
## Line Chart: Hypothetical Energy Usage Curve Amortized Over Tasks
### Overview
The image is a line chart titled "Hypothetical Energy Usage Curve Amortized Over Tasks." It visually compares the energy consumption (in kilowatt-hours, KWH) of two machine learning model architectures—BERT Base and Transformer Base—as a function of the number of tasks they are finetuned for. The chart presents a conceptual or hypothetical model, not precise empirical data.
### Components/Axes
* **Title:** "Hypothetical Energy Usage Curve Amortized Over Tasks" (located at the top center, in purple text).
* **Y-Axis (Vertical):**
* **Label:** "Energy (KWH)"
* **Scale:** The axis starts at an implied origin (0,0). A single numerical marker is present at the top of the axis: **4000**.
* **X-Axis (Horizontal):**
* **Label:** "Number of Tasks Finetuned"
* **Scale:** The axis starts at an implied origin (0,0). A single numerical marker is present at the far right: **150**.
* **Data Series & Legend:**
* **BERT Base:** Represented by a **blue line**. The label "BERT Base" is placed in the upper-left quadrant of the chart, with a line pointing directly to the blue curve.
* **Transformer Base:** Represented by a **red line**. The label "Transformer Base" is placed in the upper-center/right area, with a line pointing directly to the red curve.
* **Spatial Layout:** The chart is contained within a white box with a light gray border. The axes form an L-shape in the bottom-left. The legend labels are positioned above their respective lines for clarity.
### Detailed Analysis
* **BERT Base (Blue Line) Trend:** The line begins at a low energy value near the origin. It exhibits a very steep, almost vertical, initial increase for a small number of tasks. The slope then decreases sharply, and the curve flattens into a near-plateau, showing only a very gradual, slight upward trend as the number of tasks increases towards 150. The final value at 150 tasks appears to be significantly below the 4000 KWH mark.
* **Transformer Base (Red Line) Trend:** The line also begins at a low energy value near the origin, starting slightly below the initial point of the BERT Base line. It shows a steady, consistent, and approximately linear upward slope across the entire range of tasks. The line crosses above the BERT Base line at a point roughly one-third to one-half of the way along the x-axis. It continues its steady climb, ending at a point near the 4000 KWH level at 150 tasks.
* **Key Data Points (Approximate):**
* At **0 tasks**, both models have near-zero amortized energy usage.
* At a **low number of tasks** (e.g., <20), BERT Base's energy usage is higher than Transformer Base's.
* At a **moderate number of tasks** (estimated ~50-70), the two lines intersect, indicating equal amortized energy usage.
* At **150 tasks**, Transformer Base's energy usage (~4000 KWH) is substantially higher than BERT Base's (estimated ~2500-3000 KWH, based on visual proportion).
### Key Observations
1. **Divergent Scaling:** The two models demonstrate fundamentally different energy scaling behaviors with respect to multi-task finetuning.
2. **Crossover Point:** There is a clear crossover point where the more efficient model switches. For a small portfolio of tasks, Transformer Base appears more energy-efficient. For a large portfolio, BERT Base becomes more efficient.
3. **Plateau vs. Linear Growth:** BERT Base's energy cost appears to saturate or amortize very effectively after an initial investment, while Transformer Base's cost grows in direct proportion to the number of tasks.
4. **Hypothetical Nature:** The title explicitly states this is a "Hypothetical" curve, indicating it is a conceptual model meant to illustrate a principle rather than report measured experimental results.
### Interpretation
This chart illustrates a trade-off in energy efficiency for transfer learning across different neural network architectures. The **BERT Base** model, likely due to its masked language modeling pre-training objective and architecture, may have a high fixed energy cost for initial adaptation but marginal cost for additional tasks. This makes it efficient for large-scale, multi-task scenarios. In contrast, the **Transformer Base** model (presumably a standard encoder-decoder or similar) shows a linear relationship, suggesting its energy cost is dominated by per-task computation without significant amortization.
The implication is that the choice of base model for a finetuning project should consider the expected number of downstream tasks. For a single or few tasks, the Transformer Base might be preferable. For building a platform serving hundreds of tasks, the BERT Base architecture could offer significant long-term energy savings. The chart argues that "efficiency" is not a fixed attribute but depends on the operational context (number of tasks).