## Line Graph: Hypothetical Energy Usage Curve Amortized Over Tasks
### Overview
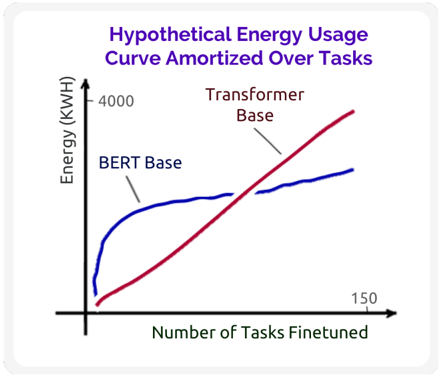
The image depicts a line graph comparing the energy usage (in kWh) of two transformer-based models, "Transformer Base" and "BERT Base," as the number of tasks finetuned increases. The graph illustrates how energy consumption scales with task finetuning for each model.
### Components/Axes
- **X-axis**: "Number of Tasks Finetuned" (ranges from 0 to 150, labeled in increments of 50).
- **Y-axis**: "Energy (kWh)" (ranges from 0 to 4000, labeled in increments of 1000).
- **Legend**: Located at the top-right corner, with two entries:
- **Red line**: "Transformer Base"
- **Blue line**: "BERT Base"
### Detailed Analysis
1. **Transformer Base (Red Line)**:
- Starts at the origin (0 tasks, 0 kWh).
- Exhibits a steep, linear upward trend, indicating energy usage increases proportionally with the number of tasks finetuned.
- Crosses the "BERT Base" line at approximately **75 tasks**, after which it surpasses the blue line.
- At 150 tasks, the energy usage is estimated to be **~3500 kWh** (approximate extrapolation).
2. **BERT Base (Blue Line)**:
- Also starts at the origin but follows a curved trajectory.
- Energy usage rises sharply initially, then plateaus around **~2500 kWh** after ~75 tasks.
- At 150 tasks, energy usage remains near **~2500 kWh**, showing minimal increase.
### Key Observations
- The **crossover point** at ~75 tasks is critical: Transformer Base consumes less energy than BERT Base for tasks <75, but more energy for tasks >75.
- Transformer Base’s energy usage grows linearly, while BERT Base’s usage stabilizes after mid-range tasks.
- At maximum finetuning (150 tasks), Transformer Base uses ~40% more energy than BERT Base.
### Interpretation
The graph suggests that **Transformer Base** is more energy-efficient than **BERT Base** for small-scale task finetuning (<75 tasks). However, as tasks increase beyond this threshold, Transformer Base’s energy consumption escalates sharply, making it less efficient in total energy usage for large-scale applications. BERT Base’s plateau indicates diminishing returns in energy consumption for additional tasks, potentially making it more sustainable for high-volume finetuning.
The "amortized" nature of the curve implies that energy costs are distributed across tasks, but the steeper slope of Transformer Base highlights its higher per-task energy demand at scale. This could influence model selection depending on whether efficiency at scale or initial task performance is prioritized.