## Composite Technical Diagram: Analog Circuit and Neural Network Simulation
### Overview
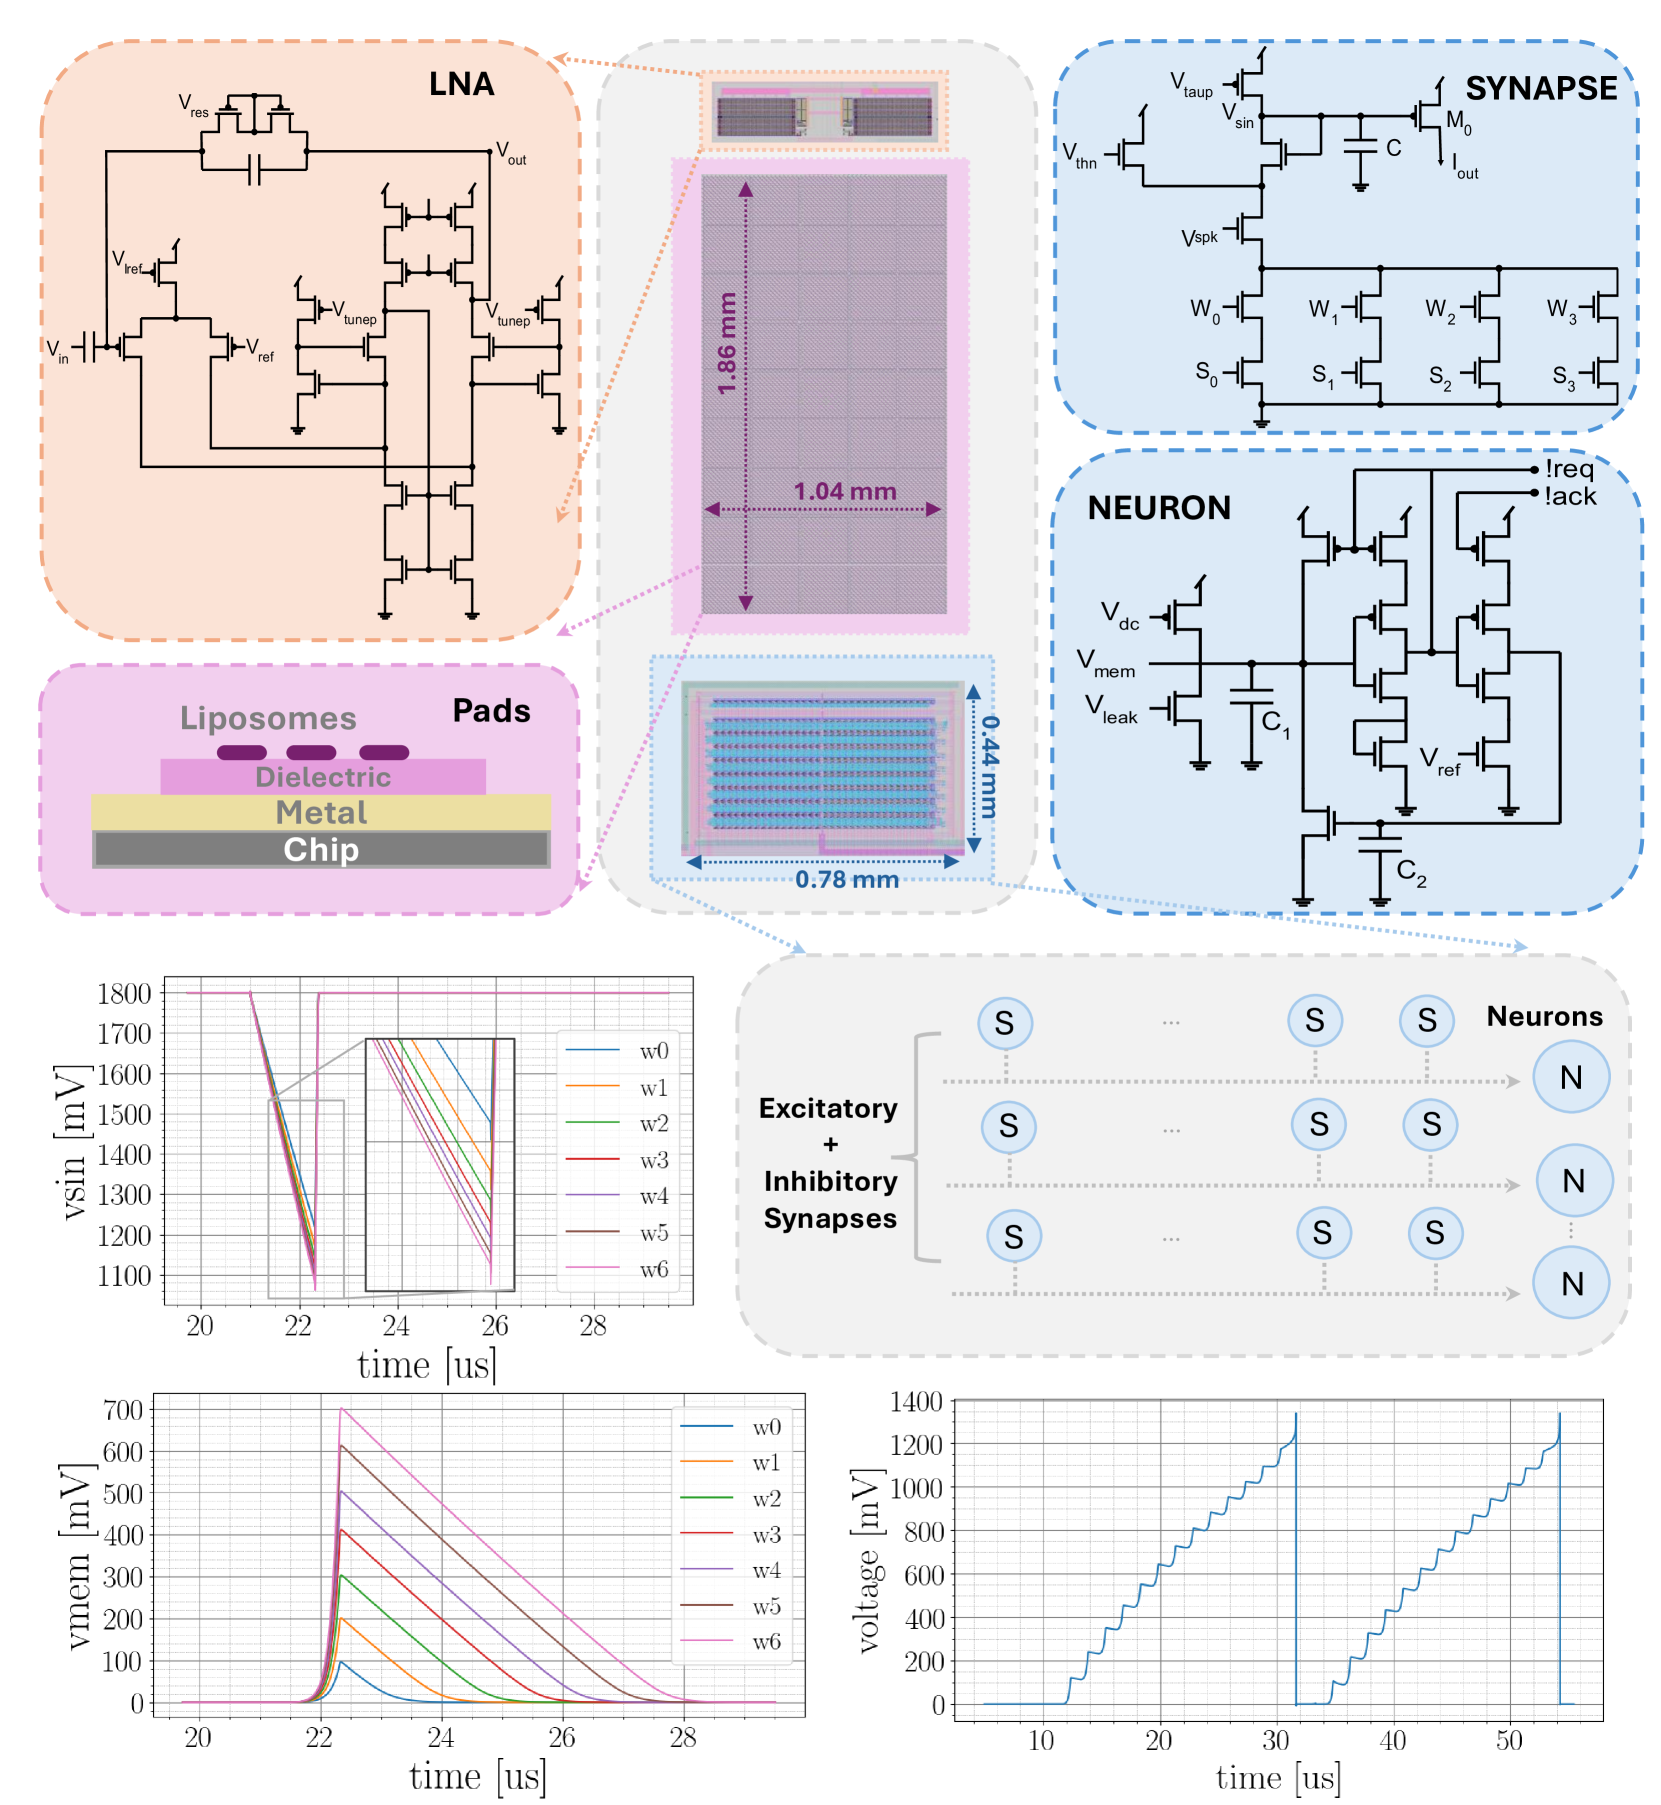
The image combines three analog circuit diagrams (LNA, SYNAPSE, NEURON) with three voltage-time charts. The diagrams illustrate signal processing components, while the charts show voltage responses over time. Key elements include component labels, connection paths, and waveform data.
### Components/Axes
**Diagrams:**
1. **LNA (Low Noise Amplifier)**
- Input: V_in → V_ref → V_res → V_out
- Tuning components: V_tunep, V_ref
- Dimensions: 1.86 mm (height) × 1.04 mm (width)
2. **SYNAPSE**
- Input: V_thn → V_taup → V_sin
- Components: M₀, C, W₀-W₃, S₀-S₃
- Output: I_out
3. **NEURON**
- Voltage sources: V_mem, V_leak, V_dc
- Capacitors: C₁, C₂
- Reference: V_ref
**Charts:**
1. **Voltage vs Time (w0-w6)**
- Axes: Time [μs] (x-axis), Voltage [mV] (y-axis)
- Legend: 7 waveforms (w0-w6) with distinct colors
- Spatial: Top-left quadrant
2. **Voltage vs Time (Single Line)**
- Axes: Time [μs] (x-axis), Voltage [mV] (y-axis)
- Spatial: Bottom-right quadrant
3. **Waveform Comparison**
- Axes: Time [μs] (x-axis), Voltage [mV] (y-axis)
- Spatial: Bottom-left quadrant
### Detailed Analysis
**Diagram Connections:**
- LNA: Resistive network with feedback loop (V_res → V_ref)
- SYNAPSE: Parallel RC networks (W₀-W₃) with sequential S₀-S₃ switches
- NEURON: Integrator circuit with leakage path (V_leak) and DC bias (V_dc)
**Chart Data:**
1. **w0-w6 Waveforms (Top-left)**
- w0: Sharp drop from 1800→1100 mV at 22μs
- w1-w3: Gradual declines (1600→1200 mV range)
- w4-w6: Steeper declines (1700→1100 mV range)
- All waveforms converge near 1000 mV by 28μs
2. **Single Waveform (Bottom-right)**
- Step-like pattern: 0→1400 mV at 30μs, 1400→0 at 40μs, repeat
3. **Waveform Comparison (Bottom-left)**
- w0: Fastest rise (0→700 mV in 2μs)
- w6: Slowest rise (0→700 mV in 6μs)
- All waveforms peak between 22-26μs
### Key Observations
1. **Component Isolation:**
- LNA: High-gain amplifier with tuning capability
- SYNAPSE: Parallel processing unit with weighted summation
- NEURON: Integrator with membrane potential modeling
2. **Chart Trends:**
- All waveforms show similar decay patterns but different time constants
- Step waveform exhibits bistable behavior (on/off states)
- w0-w6 represent different input conditions or filter responses
### Interpretation
The diagrams represent a bio-inspired analog computing system:
1. **LNA** provides clean signal amplification for neural processing
2. **SYNAPSE** implements weighted summation of excitatory/inhibitory inputs
3. **NEURON** models membrane potential dynamics with leakage and DC bias
The charts demonstrate:
- Voltage response characteristics of different synaptic weights (w0-w6)
- Spike-timing-dependent plasticity patterns in the step waveform
- Comparative analysis of input conditions through waveform decay rates
Notable: The 1.86mm×1.04mm LNA dimensions suggest a compact implementation, while the 0.78mm×0.44mm synapse array indicates high-density integration. The 28μs time scale aligns with typical neural response windows.