## Data Table: Share Price and Dividend Index
### Overview
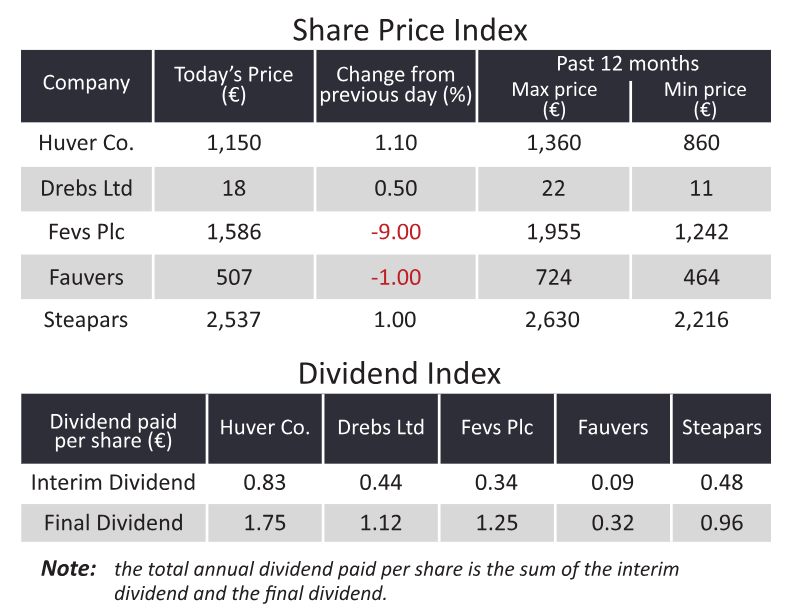
The image displays two financial data tables stacked vertically. The top table, titled "Share Price Index," provides current market data for five companies, including share prices, daily percentage changes, and 12-month price ranges. The bottom table, titled "Dividend Index," details the interim and final dividend payments per share for the same five companies. A note at the bottom clarifies the calculation method for total annual dividends.
### Components/Axes
**Table 1: Share Price Index**
* **Columns:**
* **Company:** The name of the entity.
* **Today's Price (€):** The current share price in Euros.
* **Change from previous day (%):** The percentage fluctuation in share price.
* **Past 12 months:** A sub-header containing two columns:
* **Max price (€):** The highest price reached in the last year.
* **Min price (€):** The lowest price reached in the last year.
* **Rows:** Huver Co., Drebs Ltd, Fevs Plc, Fauvers, Steapars.
**Table 2: Dividend Index**
* **Columns:**
* **Dividend paid per share (€):** The row header.
* **Company Names:** Huver Co., Drebs Ltd, Fevs Plc, Fauvers, Steapars.
* **Rows:**
* **Interim Dividend:** The dividend paid mid-year.
* **Final Dividend:** The dividend paid at the end of the year.
**Footer:**
* **Note:** "the total annual dividend paid per share is the sum of the interim dividend and the final dividend."
---
### Detailed Analysis
#### Table 1: Share Price Index
| Company | Today's Price (€) | Change from previous day (%) | Max price (€) | Min price (€) |
| :--- | :--- | :--- | :--- | :--- |
| **Huver Co.** | 1,150 | 1.10 | 1,360 | 860 |
| **Drebs Ltd** | 18 | 0.50 | 22 | 11 |
| **Fevs Plc** | 1,586 | -9.00 (Red text) | 1,955 | 1,242 |
| **Fauvers** | 507 | -1.00 (Red text) | 724 | 464 |
| **Steapars** | 2,537 | 1.00 | 2,630 | 2,216 |
#### Table 2: Dividend Index
| Dividend paid per share (€) | Huver Co. | Drebs Ltd | Fevs Plc | Fauvers | Steapars |
| :--- | :--- | :--- | :--- | :--- | :--- |
| **Interim Dividend** | 0.83 | 0.44 | 0.34 | 0.09 | 0.48 |
| **Final Dividend** | 1.75 | 1.12 | 1.25 | 0.32 | 0.96 |
---
### Key Observations
* **Market Volatility:** Fevs Plc shows a significant negative change of -9.00% in its share price, which is the most substantial movement among the listed companies.
* **Price Range:** Steapars has the highest share price (2,537) and also the highest minimum price (2,216) over the past 12 months, suggesting high stability or a high-value stock. Drebs Ltd has the lowest share price (18).
* **Dividend Consistency:** Across all five companies, the "Final Dividend" is consistently higher than the "Interim Dividend."
* **Formatting:** Negative percentage changes in the "Share Price Index" table are indicated in red text to highlight the decline.
### Interpretation
* **Corporate Financial Strategy:** The data suggests a uniform corporate policy across these entities where the majority of dividend distribution occurs at the end of the fiscal year (Final Dividend) rather than mid-year (Interim Dividend).
* **Market Sentiment:** The sharp -9.00% drop for Fevs Plc is an outlier compared to the other companies, which show either positive growth or minor declines. This suggests a specific negative event or market reaction affecting Fevs Plc.
* **Dividend Yield Potential:** While the total annual dividend can be calculated (e.g., Huver Co. pays 2.58 total, while Fauvers pays 0.41 total), the data does not explicitly state the dividend yield percentage. However, the disparity between the high share price of Steapars and its relatively modest dividend suggests it may be a growth-oriented stock rather than a high-yield income stock.