## Share Price Index and Dividend Index Tables
### Overview
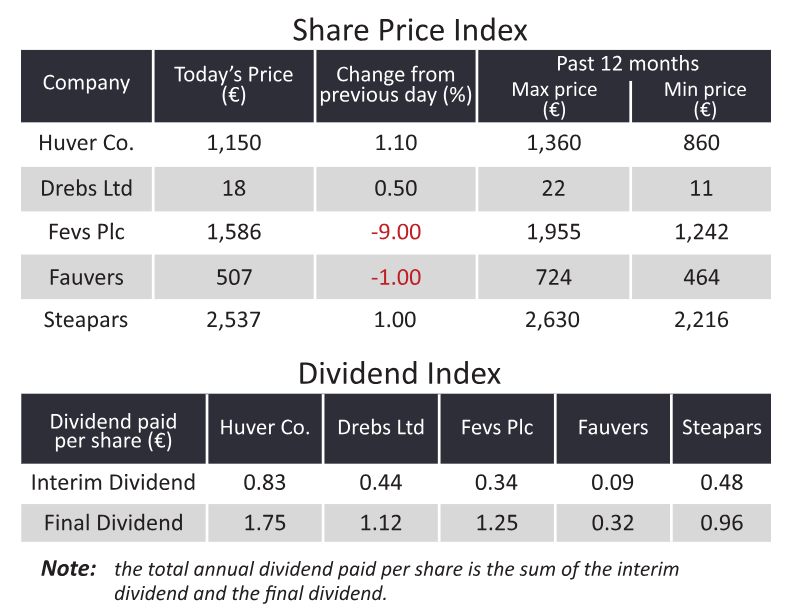
The image presents two comparative tables:
1. **Share Price Index**: Tracks stock prices, daily changes, and 12-month price ranges for five companies.
2. **Dividend Index**: Details interim and final dividends paid per share for the same companies.
### Components/Axes
#### Share Price Index Table
- **Columns**:
- **Company**: Huver Co., Drebs Ltd, Fevs Plc, Fauvers, Steapars.
- **Today’s Price (€)**: Current stock price.
- **Change from previous day (%)**: Daily percentage change (red for negative values).
- **Past 12 months**:
- **Max price (€)**: Highest price in the last year.
- **Min price (€)**: Lowest price in the last year.
#### Dividend Index Table
- **Columns**:
- **Dividend paid per share (€)**: Dividend amounts.
- **Companies**: Huver Co., Drebs Ltd, Fevs Plc, Fauvers, Steapars.
- **Rows**:
- **Interim Dividend**: Partial dividend payments.
- **Final Dividend**: Final dividend payments.
- **Note**: Total annual dividend = Interim + Final Dividend.
### Detailed Analysis
#### Share Price Index
| Company | Today’s Price (€) | Change (%) | Max Price (€) | Min Price (€) |
|-------------|-------------------|------------|---------------|---------------|
| Huver Co. | 1,150 | +1.10 | 1,360 | 860 |
| Drebs Ltd | 18 | +0.50 | 22 | 11 |
| Fevs Plc | 1,586 | **-9.00** | 1,955 | 1,242 |
| Fauvers | 507 | **-1.00** | 724 | 464 |
| Steapars | 2,537 | +1.00 | 2,630 | 2,216 |
#### Dividend Index
| Dividend Type | Huver Co. (€) | Drebs Ltd (€) | Fevs Plc (€) | Fauvers (€) | Steapars (€) |
|---------------------|---------------|---------------|--------------|-------------|--------------|
| Interim Dividend | 0.83 | 0.44 | 0.34 | 0.09 | 0.48 |
| Final Dividend | 1.75 | 1.12 | 1.25 | 0.32 | 0.96 |
### Key Observations
1. **Share Price Volatility**:
- **Fevs Plc** experienced the largest single-day drop (-9.00%), while **Houver Co.** and **Steapars** showed gains (+1.10% and +1.00%, respectively).
- **Steapars** has the highest stock price (€2,537) and the widest 12-month range (€2,630–€2,216).
- **Fauvers** and **Fevs Plc** are the only companies with negative daily changes.
2. **Dividend Payouts**:
- **Houver Co.** offers the highest total annual dividend (€2.58 = 0.83 + 1.75).
- **Fauvers** has the lowest interim dividend (€0.09) and **Fevs Plc** the lowest final dividend (€1.25).
- **Drebs Ltd** and **Steapars** show balanced dividend distributions.
### Interpretation
- **Market Performance**:
The negative changes for **Fevs Plc** and **Fauvers** suggest potential financial or sector-specific challenges. In contrast, **Houver Co.** and **Steapars** demonstrate stability or growth.
- **Dividend Strategy**:
**Houver Co.** prioritizes shareholder returns with the highest dividends, while **Fauvers** and **Fevs Plc** allocate fewer resources to dividends, possibly reinvesting in growth.
- **Risk-Return Tradeoff**:
**Steapars** combines high stock prices with moderate dividends, indicating a growth-oriented strategy. **Drebs Ltd** balances modest price fluctuations with consistent dividends.
### Spatial Grounding
- **Share Price Index**: Top section, dark header row, alternating light/dark rows for companies.
- **Dividend Index**: Bottom section, dark header row, light rows for dividend types.
- **Color Coding**: Negative price changes (Fevs Plc, Fauvers) highlighted in red.
### Trend Verification
- **Share Prices**:
- **Fevs Plc**: Sharp decline (-9.00%) despite a 12-month high of €1,955.
- **Houver Co.**: Steady growth from €860 (min) to €1,360 (max).
- **Dividends**:
- **Houver Co.**: Highest interim (€0.83) and final (€1.75) dividends.
- **Fauvers**: Minimal interim (€0.09) and final (€0.32) dividends.
### Conclusion
The data highlights divergent financial strategies: **Houver Co.** and **Steapars** focus on stability and shareholder returns, while **Fevs Plc** and **Fauvers** face short-term volatility and lower dividend payouts. Investors may prioritize **Houver Co.** for dividends and **Steapars** for growth potential.