## Causal Diagram: Directed Acyclic Graph
### Overview
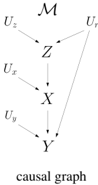
The image presents a directed acyclic graph (DAG) representing a causal model. It illustrates the relationships between variables denoted by letters (U, Z, X, Y) and their dependencies, indicated by arrows. The graph includes exogenous variables (U) influencing endogenous variables (Z, X, Y).
### Components/Axes
* **Nodes:** Represented by letters: U<sub>z</sub>, U<sub>r</sub>, Z, U<sub>x</sub>, X, U<sub>y</sub>, Y.
* **Edges:** Represented by arrows, indicating the direction of causal influence.
* **Title:** "causal graph" located at the bottom of the diagram.
* **Overall Title:** "M" located at the top of the diagram.
### Detailed Analysis
The diagram shows the following causal relationships:
* U<sub>z</sub> influences Z.
* U<sub>r</sub> influences Z and Y.
* U<sub>x</sub> influences X.
* U<sub>y</sub> influences Y.
* Z influences X.
* X influences Y.
The arrows indicate the direction of influence. For example, the arrow from U<sub>z</sub> to Z means that U<sub>z</sub> has a causal effect on Z.
### Key Observations
* Z is influenced by U<sub>z</sub> and U<sub>r</sub>.
* X is influenced by U<sub>x</sub> and Z.
* Y is influenced by U<sub>y</sub>, U<sub>r</sub>, and X.
* The graph is acyclic, meaning there are no feedback loops.
### Interpretation
The causal diagram represents a simplified model of how different variables influence each other. It suggests that Z is a mediator between U<sub>z</sub>, U<sub>r</sub> and X, and X is a mediator between Z and Y. U<sub>r</sub> also has a direct effect on Y. The exogenous variables (U<sub>z</sub>, U<sub>r</sub>, U<sub>x</sub>, U<sub>y</sub>) represent unobserved or background factors that influence the endogenous variables (Z, X, Y). The diagram can be used to analyze causal pathways and identify potential interventions to influence the outcome variable Y.