\n
## Diagram: Causal Graph
### Overview
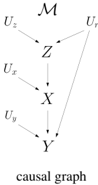
The image depicts a directed acyclic graph representing causal relationships between variables. The graph consists of nodes labeled with letters (M, Z, X, Y) and variables (U<sub>x</sub>, U<sub>y</sub>, U<sub>z</sub>, U). Arrows indicate the direction of causal influence. The diagram is labeled "causal graph" at the bottom.
### Components/Axes
The diagram consists of the following nodes:
* **M**: A top-level node.
* **Z**: A node influenced by M and U<sub>z</sub>.
* **X**: A node influenced by Z and U<sub>x</sub>.
* **Y**: A node influenced by X and U<sub>y</sub>.
* **U<sub>x</sub>**: A variable influencing X.
* **U<sub>y</sub>**: A variable influencing Y.
* **U<sub>z</sub>**: A variable influencing Z.
* **U**: A variable influencing M and Z.
The diagram uses directed edges (arrows) to represent causal relationships.
### Detailed Analysis or Content Details
The causal relationships are as follows:
* M influences Z.
* U influences M.
* U influences Z.
* U<sub>z</sub> influences Z.
* Z influences X.
* U<sub>x</sub> influences X.
* X influences Y.
* U<sub>y</sub> influences Y.
There are no numerical values or scales present in the diagram. It is a purely structural representation of causal relationships.
### Key Observations
The graph shows a hierarchical structure with M at the top and Y at the bottom. Each node (except M) is influenced by at least two other nodes or variables. The variables U<sub>x</sub>, U<sub>y</sub>, and U<sub>z</sub> represent unobserved confounders or exogenous variables influencing the respective nodes X, Y, and Z. The variable U influences both M and Z, suggesting a common cause.
### Interpretation
This causal graph illustrates a system where variables are interconnected through causal pathways. The presence of unobserved variables (U<sub>x</sub>, U<sub>y</sub>, U<sub>z</sub>, U) suggests that the observed relationships between M, Z, X, and Y may be subject to confounding. The graph can be used to reason about the effects of interventions on different variables. For example, if we were to intervene on M, we could predict the downstream effects on Z, X, and Y, taking into account the influence of the unobserved variables. The diagram is a simplified representation of a complex system, and the causal relationships may not be fully accurate or complete. It is a tool for modeling and understanding potential causal mechanisms.