## Causal Graph: Directed Acyclic Graph (DAG) of Variables
### Overview
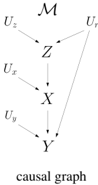
The image displays a directed acyclic graph (DAG), explicitly labeled as a "causal graph" at the bottom. It visually represents hypothesized causal relationships between a set of variables. The graph consists of nodes (variables) connected by directed edges (arrows), indicating the direction of causal influence. The structure is abstract and contains no numerical data, focusing solely on the qualitative causal pathways.
### Components/Axes
* **Nodes (Variables):** The graph contains eight labeled nodes.
* **Endogenous Variables (Likely Observed):** `M`, `Z`, `X`, `Y`. These are arranged in a rough vertical hierarchy.
* **Exogenous Variables (Likely Unobserved Confounders):** `U₁`, `U₂`, `U₃`, `U₄`. These are positioned around the periphery of the main chain.
* **Edges (Causal Links):** Solid, directed arrows connect the nodes. The direction of the arrowhead indicates the direction of hypothesized causal effect.
* **Spatial Layout:**
* `M` is positioned at the top center.
* `Z` is located directly below `M`.
* `X` is located directly below `Z`.
* `Y` is located at the bottom center, below `X`.
* `U₂` is in the top-left quadrant, pointing to `Z`.
* `U₃` is in the middle-left area, pointing to `X`.
* `U₄` is in the bottom-left area, pointing to `Y`.
* `U₁` is in the middle-right area, pointing to `Y`.
### Detailed Analysis: Causal Pathways
The graph defines the following direct causal relationships (edges):
1. `M` → `Z`
2. `U₂` → `Z`
3. `Z` → `X`
4. `U₃` → `X`
5. `X` → `Y`
6. `U₄` → `Y`
7. `U₁` → `Y`
From these direct links, several indirect pathways can be traced:
* **Primary Causal Chain:** `M` → `Z` → `X` → `Y`. This suggests `M` has an indirect effect on `Y` mediated through `Z` and `X`.
* **Confounder Paths:** The `U` variables introduce potential confounding.
* `U₂` confounds the relationship between `M` and `Z`.
* `U₃` confounds the relationship between `Z` and `X`.
* `U₄` and `U₁` are direct causes of `Y` and would confound any estimated relationship between `X` and `Y` if not controlled for.
### Key Observations
1. **`Y` as a Sink Node:** Variable `Y` is the terminal node, receiving direct causal input from three sources: `X`, `U₁`, and `U₄`.
2. **`X` as a Key Mediator:** Variable `X` sits on the main pathway from `M` to `Y` and is itself influenced by both `Z` and the confounder `U₃`.
3. **Absence of Direct `M` to `Y` Link:** There is no direct arrow from `M` to `Y`. Any effect of `M` on `Y` must be mediated through `Z` and `X`.
4. **No Cyclic Dependencies:** The graph is acyclic, as required for a standard causal model, with no feedback loops.
### Interpretation
This causal graph is a formal representation used in fields like epidemiology, economics, and social sciences to model a system of interest and guide analysis. It makes explicit assumptions about what causes what.
* **What it Suggests:** The graph posits that `X` is a direct cause of `Y`. However, estimating the true causal effect of `X` on `Y` is complicated by the presence of the unobserved confounders `U₃` (which affects both `X` and, indirectly through `X`, `Y`) and `U₄` and `U₁` (which directly affect `Y`). The variable `M` could potentially serve as an **instrumental variable** for estimating the effect of `X` on `Y` if specific assumptions hold (e.g., `M` affects `Y` only through `X`, and `M` is independent of the confounders `U₃`, `U₄`, `U₁`).
* **Relationships:** The diagram hierarchically clusters `M`, `Z`, `X`, and `Y` as the core chain of interest, while isolating the `U` variables as external sources of bias. The placement of `U` nodes on the left and right visually separates them from the main pathway.
* **Anomalies/Notes:** The graph is purely theoretical. Its validity depends entirely on whether the depicted relationships match reality. The lack of any observed parent for `M` suggests it may be an exogenous variable or instrument in this model. The explicit labeling of `U` variables as separate from the main chain is a standard convention to denote unobserved factors that must be considered in analysis.