# Technical Document Extraction: Warpgroup Execution Timeline
## 1. Document Overview
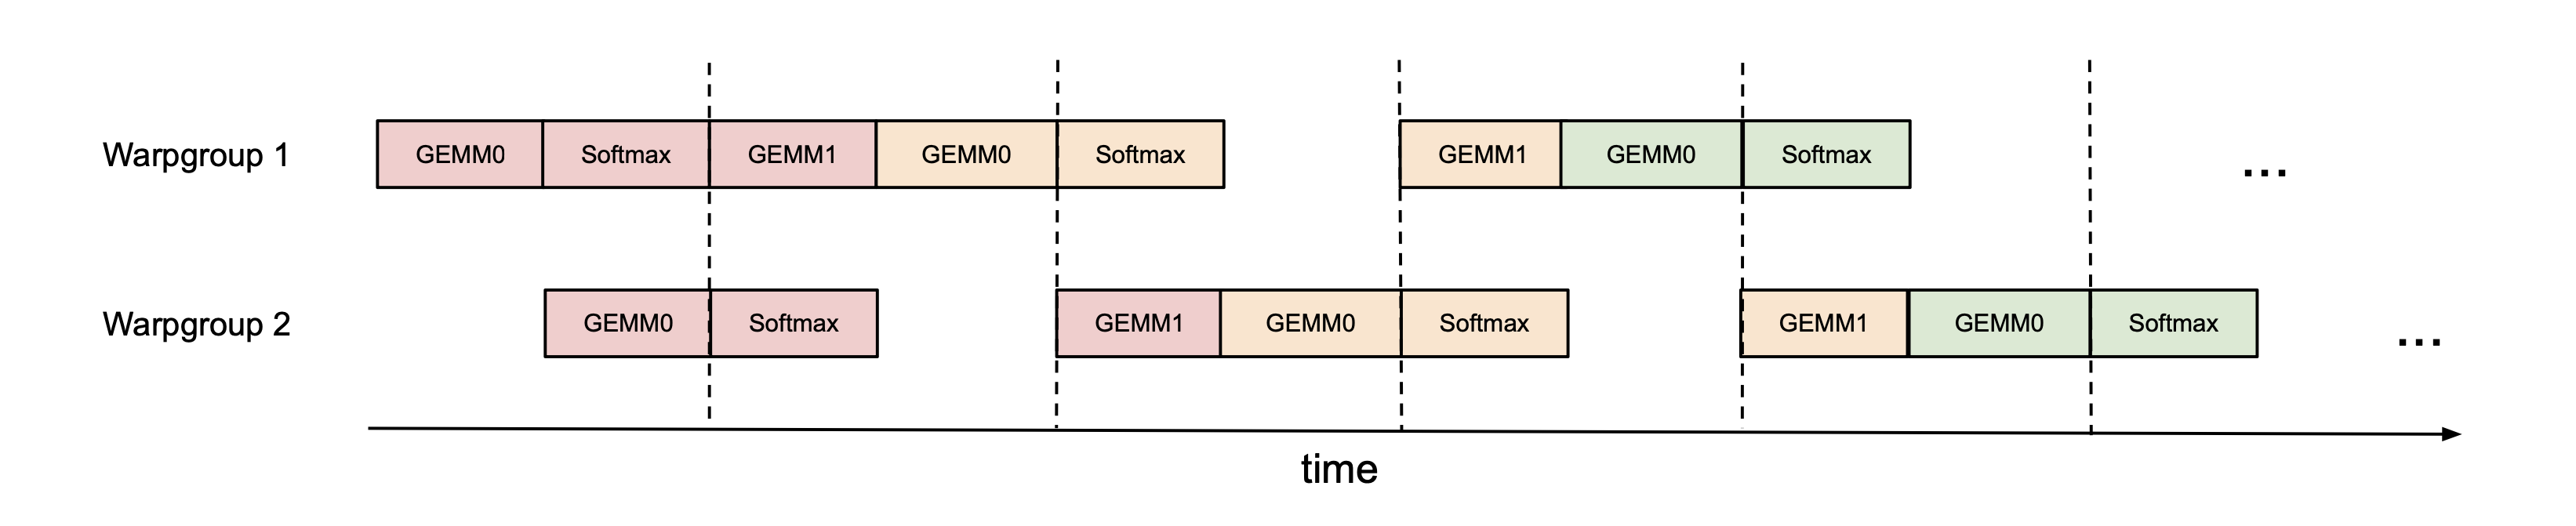
This image is a technical timing diagram (Gantt-style chart) illustrating the parallel execution of computational tasks across two processing units, identified as **Warpgroup 1** and **Warpgroup 2**. The diagram visualizes how General Matrix Multiplication (GEMM) and Softmax operations are pipelined and synchronized over time.
## 2. Axis and Labels
* **Y-Axis (Vertical Categories):**
* **Warpgroup 1**: The top horizontal track of execution.
* **Warpgroup 2**: The bottom horizontal track of execution.
* **X-Axis (Horizontal Dimension):**
* Labeled as **"time"** with a right-pointing arrow indicating chronological progression.
* **Synchronization Markers:** Five vertical dashed lines intersect both warpgroup tracks, indicating synchronization points or stage boundaries.
## 3. Component Analysis (Task Blocks)
The diagram uses color-coded blocks to represent specific operations. There are three primary operation types: **GEMM0**, **GEMM1**, and **Softmax**.
### Color Coding and Grouping
The blocks are grouped by color, likely representing different stages or iterations of a pipeline:
1. **Pink Blocks:** Initial stage operations.
2. **Orange/Tan Blocks:** Intermediate stage operations.
3. **Green Blocks:** Final visible stage operations.
## 4. Execution Flow and Sequence
The diagram shows a staggered, pipelined execution where Warpgroup 2 starts its operations after Warpgroup 1 has completed its first task.
### Warpgroup 1 Sequence
1. **Stage 1 (Pink):** `GEMM0` $\rightarrow$ `Softmax` $\rightarrow$ `GEMM1` (Crosses first sync line).
2. **Stage 2 (Orange):** `GEMM0` $\rightarrow$ `Softmax` (Crosses second sync line).
3. **Stage 3 (Orange/Tan):** `GEMM1` (Starts after a gap following the third sync line).
4. **Stage 4 (Green):** `GEMM0` $\rightarrow$ `Softmax` (Crosses fourth sync line).
5. **Continuation:** Ellipsis (`...`) indicates the pattern continues.
### Warpgroup 2 Sequence
1. **Stage 1 (Pink):** Starts later than WG1. `GEMM0` $\rightarrow$ `Softmax` (Crosses first sync line).
2. **Stage 2 (Pink/Orange):** `GEMM1` (Pink) $\rightarrow$ `GEMM0` (Orange) $\rightarrow$ `Softmax` (Orange) (Crosses second and third sync lines).
3. **Stage 3 (Orange/Green):** `GEMM1` (Orange) $\rightarrow$ `GEMM0` (Green) $\rightarrow$ `Softmax` (Green) (Crosses fourth and fifth sync lines).
4. **Continuation:** Ellipsis (`...`) indicates the pattern continues.
## 5. Data Table Reconstruction
The following table maps the operations to the intervals defined by the vertical dashed synchronization lines (S1 through S5).
| Warpgroup | Pre-S1 | S1 to S2 | S2 to S3 | S3 to S4 | S4 to S5 | Post-S5 |
| :--- | :--- | :--- | :--- | :--- | :--- | :--- |
| **Warpgroup 1** | GEMM0 (P), Softmax (P) | GEMM1 (P), GEMM0 (O) | Softmax (O) | (Idle Gap) | GEMM1 (O), GEMM0 (G) | Softmax (G), ... |
| **Warpgroup 2** | (Idle), GEMM0 (P) | Softmax (P), GEMM1 (P) | GEMM0 (O), Softmax (O) | (Idle Gap) | GEMM1 (O), GEMM0 (G) | Softmax (G), ... |
*(Legend: P = Pink, O = Orange/Tan, G = Green)*
## 6. Technical Observations
* **Pipelining:** The diagram demonstrates a software pipeline. While Warpgroup 1 is working on the `GEMM0` of a new stage (Orange), Warpgroup 2 is finishing the `Softmax` of the previous stage (Pink).
* **Dependency/Stall:** There is a notable gap (idle time) for both warpgroups between the third and fourth synchronization lines, followed by the resumption of `GEMM1`.
* **Symmetry:** After the initial startup phase, the execution patterns of Warpgroup 1 and Warpgroup 2 become synchronized in terms of the types of operations performed between the dashed lines, though they remain offset by one operation block.