# Technical Document Extraction: Diagram Analysis
## Labels and Axis Titles
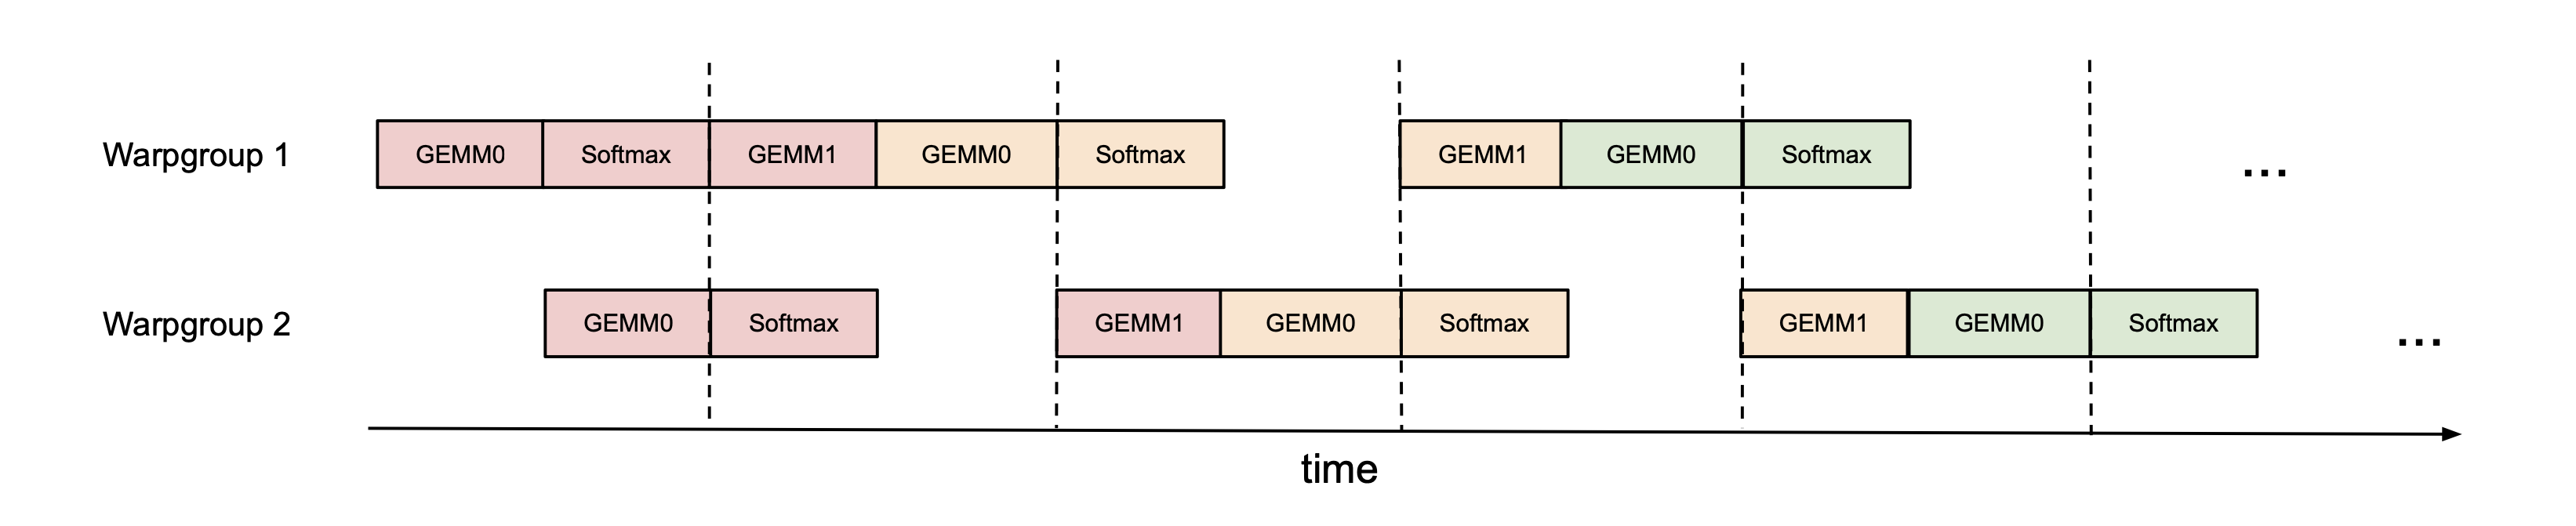
- **X-axis**: Labeled "time" with a rightward arrow indicating progression.
- **Y-axis**: Two horizontal tracks labeled:
- **Warpgroup 1** (top track)
- **Warpgroup 2** (bottom track)
## Diagram Components
The diagram illustrates a **sequential process** across two warpgroups over time, with blocks representing operations. Key elements include:
1. **Blocks**:
- **GEMM0**: Represented by **pink** blocks.
- **GEMM1**: Represented by **light orange** blocks.
- **Softmax**: Represented by **green** blocks.
2. **Dashed Vertical Lines**: Mark **time intervals** (e.g., between operations).
3. **Ellipses (…)**: Indicate **continuation** of the pattern beyond the shown timeline.
## Color Coding
- **Pink**: GEMM0 operations.
- **Light Orange**: GEMM1 operations.
- **Green**: Softmax operations.
- **No explicit legend** is present, but colors are directly embedded in the diagram.
## Time Intervals
- Dashed lines divide the timeline into discrete intervals, separating operations in each warpgroup.
- Example sequence for **Warpgroup 1**:
- GEMM0 → Softmax → GEMM1 → GEMM0 → Softmax → GEMM1 → GEMM0 → Softmax → ...
- Example sequence for **Warpgroup 2**:
- GEMM0 → Softmax → GEMM1 → GEMM0 → Softmax → GEMM1 → GEMM0 → Softmax → ...
## Continuation
- The ellipses (… ) at the end of both warpgroups suggest the pattern **repeats indefinitely** over time.
## Key Observations
- **Warpgroup 1** and **Warpgroup 2** have **different operation sequences**, though both follow a cyclical pattern of GEMM0 → GEMM1 → Softmax.
- The **color coding** (pink, light orange, green) is consistent across both warpgroups, ensuring visual clarity for operation types.
- The **dashed lines** emphasize temporal separation between operations, critical for understanding the workflow.
## Summary
This diagram models a **time-dependent workflow** for two warpgroups, with operations (GEMM0, GEMM1, Softmax) executed in a repeating sequence. The use of color and dashed lines provides a clear visual representation of temporal and operational relationships.