# Technical Document Extraction: Pie Chart Analysis
## Image Description
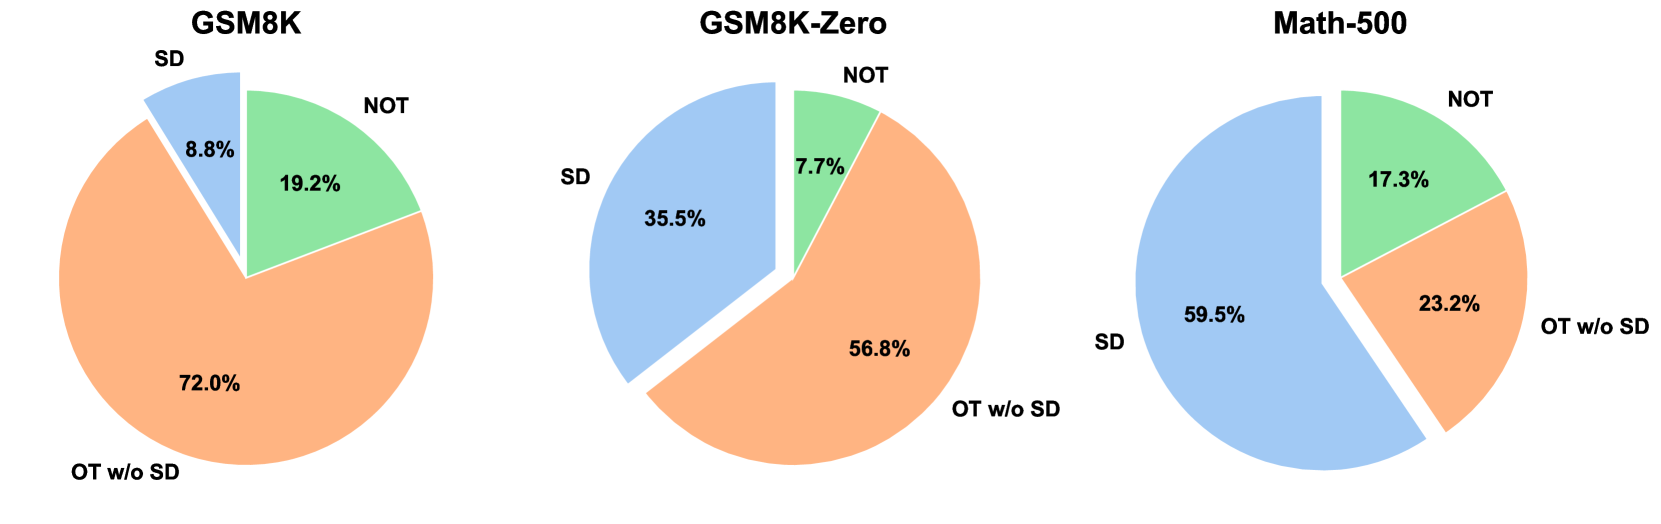
The image contains three pie charts arranged horizontally, each representing different datasets. The charts are labeled as follows:
1. **GSM8K**
2. **GSM8K-Zero**
3. **Math-500**
Each chart uses three color-coded segments (orange, blue, green) to represent categorical data. No explicit legend box is present; color associations are embedded within the chart segments.
---
## Chart 1: GSM8K
### Labels and Data Points
- **OT w/o SD**: 72.0% (orange)
- **SD**: 8.8% (blue)
- **NOT**: 19.2% (green)
### Spatial Grounding
- Legend colors are embedded in segment colors:
- Orange = OT w/o SD
- Blue = SD
- Green = NOT
### Trend Verification
- **Dominant Category**: OT w/o SD (72.0%) significantly outweighs other categories.
- **Secondary Category**: NOT (19.2%) is twice the size of SD (8.8%).
---
## Chart 2: GSM8K-Zero
### Labels and Data Points
- **OT w/o SD**: 56.8% (orange)
- **SD**: 35.5% (blue)
- **NOT**: 7.7% (green)
### Spatial Grounding
- Legend colors are embedded in segment colors:
- Orange = OT w/o SD
- Blue = SD
- Green = NOT
### Trend Verification
- **Balanced Distribution**: OT w/o SD (56.8%) and SD (35.5%) are closer in magnitude compared to GSM8K.
- **Minor Category**: NOT (7.7%) remains the smallest segment.
---
## Chart 3: Math-500
### Labels and Data Points
- **SD**: 59.5% (blue)
- **OT w/o SD**: 23.2% (orange)
- **NOT**: 17.3% (green)
### Spatial Grounding
- Legend colors are embedded in segment colors:
- Blue = SD
- Orange = OT w/o SD
- Green = NOT
### Trend Verification
- **Reversed Dominance**: SD (59.5%) is the largest category, surpassing OT w/o SD (23.2%).
- **NOT** (17.3%) is the smallest but larger than in GSM8K-Zero.
---
## Cross-Chart Analysis
1. **Color Consistency**:
- **Orange** consistently represents "OT w/o SD" across all charts.
- **Blue** represents "SD" in GSM8K-Zero and Math-500 but "SD" in GSM8K.
- **Green** consistently represents "NOT" across all charts.
2. **Data Trends**:
- **GSM8K**: High dominance of "OT w/o SD" (72.0%).
- **GSM8K-Zero**: More balanced between "OT w/o SD" (56.8%) and "SD" (35.5%).
- **Math-500**: "SD" dominates (59.5%), with "OT w/o SD" reduced to 23.2%.
3. **NOT Category**:
- Largest in GSM8K (19.2%).
- Smallest in GSM8K-Zero (7.7%).
- Intermediate in Math-500 (17.3%).
---
## Notes
- No additional languages or textual elements are present.
- All percentages sum to 100% for each chart, confirming data integrity.
- No axis titles or numerical scales are present, as these are pie charts.