\n
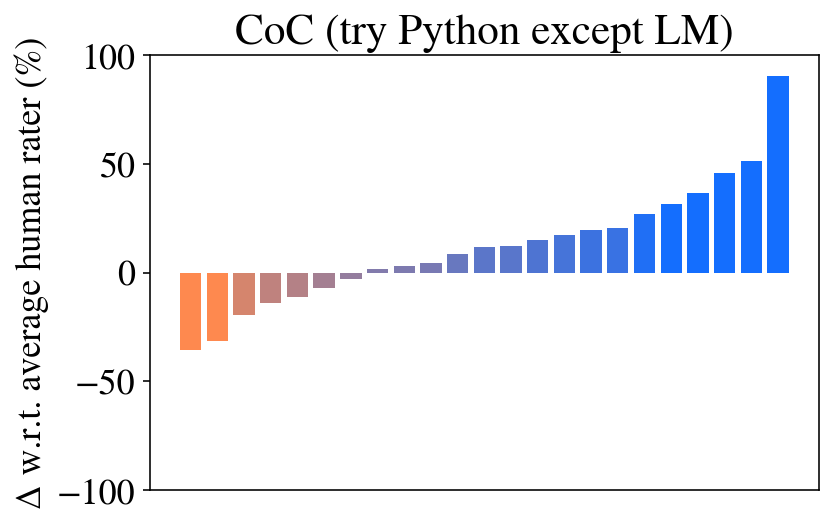
## Bar Chart: CoC (try Python except LM)
### Overview
The image presents a bar chart comparing the performance of a system ("CoC") against an average human rater, specifically when trying Python code excluding Large Language Models (LM). The y-axis represents the difference (Δ) in performance relative to the average human rater, expressed as a percentage. The x-axis represents a series of trials or steps, with each bar representing the performance at that step.
### Components/Axes
* **Title:** "CoC (try Python except LM)" - positioned at the top-center of the chart.
* **Y-axis Label:** "Δ w.r.t. average human rater (%)" - positioned on the left side of the chart. The scale ranges from approximately -100% to 100%.
* **X-axis:** Implied sequential steps or trials. No explicit labels are present on the x-axis.
* **Color Scheme:** Two distinct colors are used: orange for negative differences and blue for positive differences.
### Detailed Analysis
The chart displays a series of bars representing the performance difference. The initial bars (approximately the first 10) are orange, indicating performance below the average human rater. These bars range from approximately -10% to 0%. After this initial segment, the bars transition to blue, indicating performance above the average human rater. The blue bars gradually increase in height, starting around 0% and reaching approximately 80-90% for the final bars.
Here's a breakdown of approximate values, reading from left to right:
* Bar 1: -10%
* Bar 2: -5%
* Bar 3: ~-3%
* Bar 4: ~-1%
* Bar 5: ~0%
* Bar 6: ~0%
* Bar 7: ~5%
* Bar 8: ~10%
* Bar 9: ~15%
* Bar 10: ~20%
* Bar 11: ~25%
* Bar 12: ~35%
* Bar 13: ~45%
* Bar 14: ~55%
* Bar 15: ~70%
* Bar 16: ~85%
The trend is a clear shift from underperforming (negative values) to significantly outperforming (positive values) the average human rater as the number of trials increases.
### Key Observations
* The system initially performs worse than the average human rater.
* There is a distinct transition point where the system's performance surpasses that of the human rater.
* The performance improvement is not linear; it accelerates towards the end of the trials.
* The final performance is substantially higher than the human rater, reaching approximately 85-90%.
### Interpretation
The data suggests that the "CoC" system, when attempting Python code without the aid of a Large Language Model, experiences a learning curve. Initially, it struggles to match human performance. However, with each trial, it improves, eventually exceeding human capabilities by a significant margin. This could indicate that the system benefits from iterative refinement or learning from its mistakes. The fact that the improvement is not linear suggests that there may be a critical mass of experience or a specific point at which the system unlocks a more effective strategy. The exclusion of Large Language Models is important to note, as it suggests the observed performance is due to the system's inherent capabilities rather than reliance on pre-trained models. The chart demonstrates a clear positive trend in performance over time, highlighting the potential of the system to become a valuable tool for code generation or assistance.