## Line Chart: Training Compute (ExaFLOPs) vs. Test Cross-Entropy Loss
### Overview
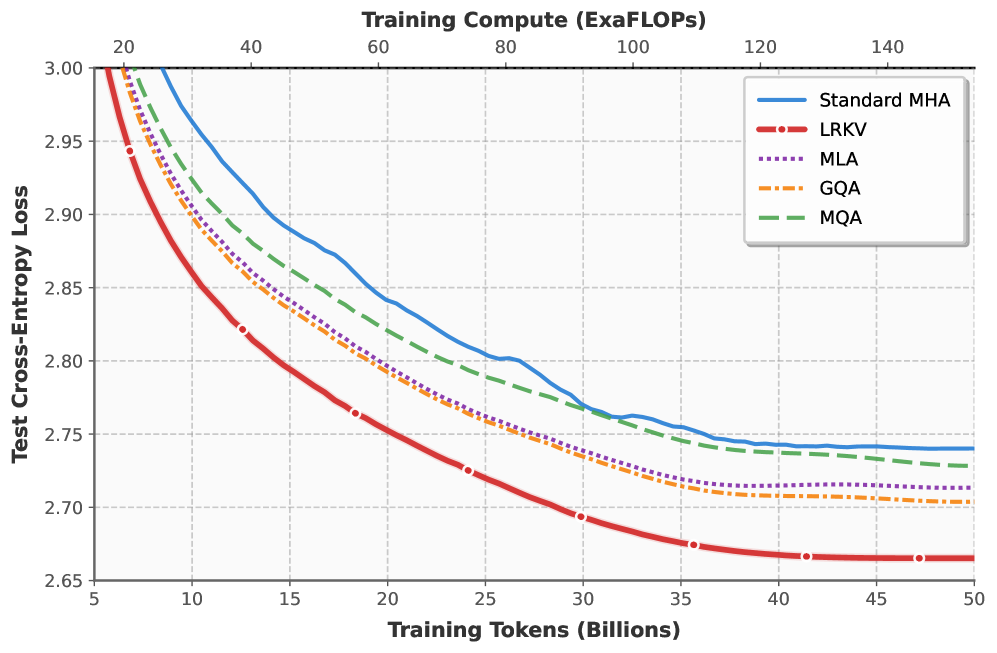
The chart visualizes the relationship between training compute (measured in ExaFLOPs) and test cross-entropy loss for five different model architectures. The x-axis represents training tokens (in billions), while the y-axis shows test cross-entropy loss values. Five distinct lines represent different methods: Standard MHA (blue), LRKV (red), MLA (purple), GQA (orange), and MQA (green). All lines exhibit a downward trend, indicating improved performance (lower loss) with increased training compute.
### Components/Axes
- **X-axis**: "Training Tokens (Billions)" with markers at 5, 10, 15, 20, 25, 30, 35, 40, 45, and 50.
- **Y-axis**: "Test Cross-Entropy Loss" with markers from 2.65 to 3.00 in increments of 0.05.
- **Legend**: Located in the top-right corner, mapping colors to methods:
- Blue: Standard MHA
- Red: LRKV
- Purple: MLA
- Orange: GQA
- Green: MQA
- **Line Styles**: All lines are solid except for MLA (dotted) and GQA (dashed).
### Detailed Analysis
1. **Standard MHA (Blue)**:
- Starts at ~3.00 loss at 5B tokens.
- Gradually declines to ~2.74 loss at 50B tokens.
- Steepest decline occurs between 5B and 20B tokens.
2. **LRKV (Red)**:
- Begins at ~3.00 loss at 5B tokens.
- Drops sharply to ~2.66 loss at 50B tokens.
- Most rapid improvement observed between 5B and 15B tokens.
3. **MLA (Purple)**:
- Starts at ~3.00 loss at 5B tokens.
- Declines to ~2.72 loss at 50B tokens.
- Moderate slope with consistent improvement.
4. **GQA (Orange)**:
- Begins at ~3.00 loss at 5B tokens.
- Reduces to ~2.71 loss at 50B tokens.
- Slightly flatter slope compared to MLA.
5. **MQA (Green)**:
- Starts at ~3.00 loss at 5B tokens.
- Decreases to ~2.73 loss at 50B tokens.
- Intermediate performance between MLA and GQA.
### Key Observations
- **LRKV** demonstrates the most significant improvement, achieving the lowest loss (~2.66) at 50B tokens.
- **Standard MHA** shows the slowest rate of improvement, with loss remaining above 2.74 even at 50B tokens.
- All methods exhibit diminishing returns as training tokens increase beyond 20B.
- The gap between LRKV and other methods widens as compute scales, suggesting superior efficiency.
### Interpretation
The chart highlights the trade-off between training compute and model performance. LRKV outperforms other methods by achieving the lowest cross-entropy loss with the same compute budget, indicating superior architectural efficiency. Standard MHA, while requiring the most compute to reach comparable performance, may reflect baseline limitations in its design. The diminishing returns observed across all methods suggest that beyond a certain compute threshold (likely ~20B tokens), additional resources yield smaller performance gains. This data could guide resource allocation decisions, favoring architectures like LRKV for compute-constrained scenarios or Standard MHA for applications where compute is abundant but performance requirements are less stringent.