## Scatter Plot: BERT-type Model Performance vs. Size
### Overview
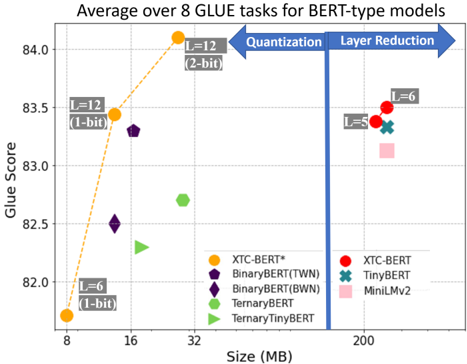
This scatter plot visualizes the performance (Glue Score) of various BERT-type models against their size (in MB). The plot shows the trade-off between model size and performance, with different models employing techniques like quantization and layer reduction. The data is averaged over 8 GLUE tasks.
### Components/Axes
* **X-axis:** Size (MB), ranging from approximately 8 MB to 200 MB.
* **Y-axis:** Glue Score, ranging from approximately 82.0 to 84.0.
* **Title:** "Average over 8 GLUE tasks for BERT-type models"
* **Annotations:** Two horizontal arrows labeled "Quantization" (pointing left) and "Layer Reduction" (pointing right).
* **Legend:** Located in the bottom-center of the plot, with the following entries:
* XTC-BERT* (Orange)
* BinaryBERT(TWN) (Purple)
* BinaryBERT(BWN) (Dark Purple)
* TernaryBERT (Green)
* TernaryTinyBERT (Light Green)
* XTC-BERT (Red)
* TinyBERT (Teal)
* MiniLMv2 (Pink)
### Detailed Analysis
The plot contains several data series represented by different colored markers.
* **XTC-BERT* (Orange):** This series shows a strong upward trend.
* At approximately 8 MB, the Glue Score is around 82.2 (labeled "L=6 (1-bit)").
* At approximately 16 MB, the Glue Score is around 83.6 (labeled "L=12 (1-bit)").
* At approximately 32 MB, the Glue Score is around 84.0 (labeled "L=12 (2-bit)").
* **BinaryBERT(TWN) (Purple):** This series shows a decreasing trend.
* At approximately 8 MB, the Glue Score is around 83.2.
* At approximately 16 MB, the Glue Score is around 83.1.
* **BinaryBERT(BWN) (Dark Purple):** This series shows a decreasing trend.
* At approximately 8 MB, the Glue Score is around 82.7.
* At approximately 16 MB, the Glue Score is around 82.4.
* **TernaryBERT (Green):** This series shows a relatively flat trend.
* At approximately 32 MB, the Glue Score is around 82.7.
* **TernaryTinyBERT (Light Green):** This series shows a relatively flat trend.
* At approximately 32 MB, the Glue Score is around 82.5.
* **XTC-BERT (Red):** This series shows a relatively flat trend.
* At approximately 200 MB, the Glue Score is around 83.7 (labeled "L=6").
* **TinyBERT (Teal):** This series shows a relatively flat trend.
* At approximately 200 MB, the Glue Score is around 83.5 (labeled "L=5").
* **MiniLMv2 (Pink):** This series shows a relatively flat trend.
* At approximately 200 MB, the Glue Score is around 83.4.
### Key Observations
* The XTC-BERT* model demonstrates the most significant improvement in Glue Score with increasing size, particularly when moving from 8 MB to 32 MB.
* Models employing quantization (indicated by the "Quantization" arrow) generally have smaller sizes but potentially lower Glue Scores compared to models with layer reduction.
* Models with layer reduction (indicated by the "Layer Reduction" arrow) tend to have larger sizes but potentially higher Glue Scores.
* BinaryBERT(TWN) and BinaryBERT(BWN) show a slight decrease in performance as size increases.
* The models on the right side of the plot (XTC-BERT, TinyBERT, MiniLMv2) are significantly larger in size (around 200 MB) compared to the models on the left (8-32 MB).
### Interpretation
The data suggests a trade-off between model size and performance for BERT-type models. Increasing model size generally leads to improved performance, as demonstrated by the XTC-BERT* series. However, techniques like quantization and layer reduction can be used to optimize model size while maintaining acceptable performance levels. The horizontal arrows indicate the direction of these optimization strategies. The plot highlights that different models achieve different balances between size and performance, and the optimal choice depends on the specific application and resource constraints. The slight decrease in performance for BinaryBERT(TWN) and BinaryBERT(BWN) as size increases could indicate diminishing returns or potential overfitting. The clustering of models around 83-84 Glue Score at 200MB suggests a performance ceiling for these architectures.