## Scatter Plot: Average over 8 GLUE tasks for BERT-type models
### Overview
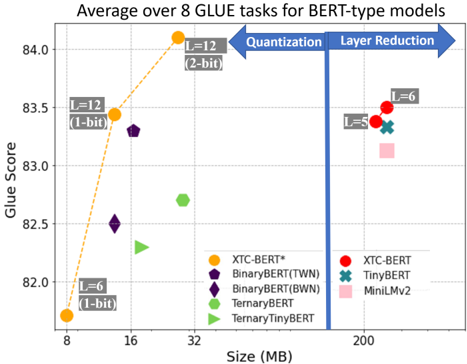
The chart compares BERT-type models across two dimensions: **model size (MB)** and **GLUE task performance (Glue Score)**. It highlights trade-offs between model efficiency (size) and accuracy, with annotations for quantization and layer reduction techniques. Data points are color-coded and shaped to represent specific models, with trends visualized via lines and arrows.
---
### Components/Axes
- **X-axis (Size)**: Labeled "Size (MB)" with ticks at 8, 16, 32, and 200 MB.
- **Y-axis (Glue Score)**: Labeled "Glue Score" with increments of 0.5, ranging from 82.0 to 84.0.
- **Legend**: Located in the bottom-right, mapping colors/shapes to models:
- **Orange circle**: XTC-BERT*
- **Purple pentagon**: BinaryBERT(TWN)
- **Dark purple diamond**: BinaryBERT(BWN)
- **Green hexagon**: TernaryBERT
- **Light green triangle**: TernaryTinyBERT
- **Red circle**: XTC-BERT
- **Teal cross**: TinyBERT
- **Pink square**: MiniLMv2
- **Arrows**: Two blue arrows labeled "Quantization" (left) and "Layer Reduction" (right), pointing toward increasing model size.
---
### Detailed Analysis
1. **XTC-BERT* (Orange Circle)**:
- **Size**: 8 MB (smallest).
- **Glue Score**: ~82.0 (lowest).
- **Label**: "L=12 (1-bit)" (12 layers, 1-bit quantization).
2. **BinaryBERT(TWN) (Purple Pentagon)**:
- **Size**: ~16 MB.
- **Glue Score**: ~82.5.
- **Label**: "L=12 (1-bit)" (same as XTC-BERT*).
3. **TernaryBERT (Green Hexagon)**:
- **Size**: ~32 MB.
- **Glue Score**: ~82.7.
- **Label**: "L=12 (2-bit)" (12 layers, 2-bit quantization).
4. **TernaryTinyBERT (Light Green Triangle)**:
- **Size**: ~32 MB.
- **Glue Score**: ~82.3.
- **Label**: "L=6 (1-bit)" (6 layers, 1-bit quantization).
5. **XTC-BERT (Red Circle)**:
- **Size**: 200 MB (largest).
- **Glue Score**: ~83.5.
- **Label**: "L=6 (1-bit)" (6 layers, 1-bit quantization).
6. **TinyBERT (Teal Cross)**:
- **Size**: 200 MB.
- **Glue Score**: ~83.3.
- **Label**: "L=5 (1-bit)" (5 layers, 1-bit quantization).
7. **MiniLMv2 (Pink Square)**:
- **Size**: 200 MB.
- **Glue Score**: ~83.2.
- **Label**: Not explicitly labeled but inferred from position.
---
### Key Observations
1. **Size vs. Performance Trade-off**:
- Smaller models (8–32 MB) achieve lower Glue Scores (82.0–82.7).
- Larger models (200 MB) achieve higher scores (83.2–83.5), suggesting improved performance with increased size.
2. **Quantization Impact**:
- The orange dashed line connects XTC-BERT* (8 MB, 82.0) to TernaryBERT (32 MB, 82.7), showing a steep upward trend. This implies quantization (1-bit to 2-bit) improves performance while increasing size.
3. **Layer Reduction**:
- Models at 200 MB (XTC-BERT, TinyBERT, MiniLMv2) use fewer layers (L=5–6) but achieve higher scores than smaller models. This suggests layer reduction (e.g., L=12 → L=6) may optimize performance without sacrificing accuracy.
4. **Anomalies**:
- TernaryTinyBERT (32 MB, 82.3) underperforms TernaryBERT (32 MB, 82.7) despite similar size, possibly due to differences in quantization or architecture.
---
### Interpretation
The chart demonstrates that **larger models (200 MB)** with fewer layers (L=5–6) and 1-bit quantization outperform smaller models (8–32 MB) with more layers (L=12) and lower quantization (1–2-bit). This suggests:
- **Quantization** (1-bit vs. 2-bit) improves performance but increases size.
- **Layer reduction** (L=12 → L=6) may enhance efficiency without significant accuracy loss.
- The **orange line** (XTC-BERT*) highlights a trade-off: increasing size via quantization boosts performance but requires more resources.
The data underscores the balance between model complexity (size, layers) and efficiency (quantization) in achieving optimal GLUE task performance.