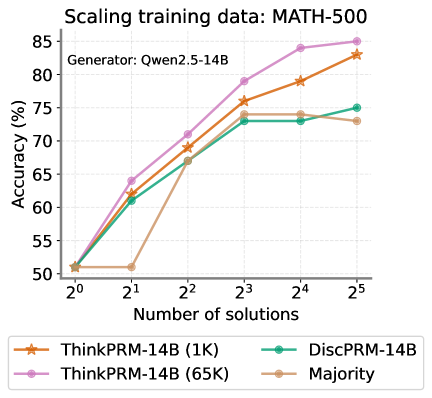
## Chart: Scaling Training Data for MATH-500
### Overview
The image is a line chart comparing the accuracy (%) of different models (ThinkPRM-14B (1K), ThinkPRM-14B (65K), DiscPRM-14B, and Majority) against the number of solutions (ranging from 2^0 to 2^5) used for training data. The chart title is "Scaling training data: MATH-500" and it indicates that the generator used was "Qwen2.5-14B".
### Components/Axes
* **Title:** Scaling training data: MATH-500
* **Subtitle:** Generator: Qwen2.5-14B
* **Y-axis:** Accuracy (%) with scale from 50 to 85, incrementing by 5.
* **X-axis:** Number of solutions, with values 2^0, 2^1, 2^2, 2^3, 2^4, and 2^5.
* **Legend:** Located at the bottom of the chart.
* ThinkPRM-14B (1K) - Orange line with star markers
* ThinkPRM-14B (65K) - Pink line with circle markers
* DiscPRM-14B - Teal line with circle markers
* Majority - Tan line with circle markers
### Detailed Analysis
* **ThinkPRM-14B (1K) (Orange):**
* Trend: Generally increasing.
* Data Points:
* 2^0: ~51%
* 2^1: ~51%
* 2^2: ~69%
* 2^3: ~79%
* 2^4: ~80%
* 2^5: ~83%
* **ThinkPRM-14B (65K) (Pink):**
* Trend: Increasing, then plateaus slightly.
* Data Points:
* 2^0: ~51%
* 2^1: ~64%
* 2^2: ~71%
* 2^3: ~79%
* 2^4: ~83%
* 2^5: ~85%
* **DiscPRM-14B (Teal):**
* Trend: Increasing initially, then plateaus.
* Data Points:
* 2^0: ~51%
* 2^1: ~62%
* 2^2: ~69%
* 2^3: ~74%
* 2^4: ~73%
* 2^5: ~75%
* **Majority (Tan):**
* Trend: Increasing initially, then plateaus.
* Data Points:
* 2^0: ~51%
* 2^1: ~51%
* 2^2: ~69%
* 2^3: ~73%
* 2^4: ~73%
* 2^5: ~73%
### Key Observations
* ThinkPRM-14B (65K) consistently achieves the highest accuracy across all numbers of solutions.
* The Majority model plateaus at a lower accuracy compared to the other models.
* All models start at approximately the same accuracy (~51%) when the number of solutions is 2^0.
* The accuracy of DiscPRM-14B and Majority models plateaus after 2^3 solutions.
* ThinkPRM-14B (1K) and ThinkPRM-14B (65K) continue to increase in accuracy up to 2^5 solutions.
### Interpretation
The chart illustrates the impact of scaling training data (number of solutions) on the accuracy of different models for the MATH-500 dataset. The ThinkPRM-14B (65K) model demonstrates the best performance, suggesting that increasing the training data size significantly improves its accuracy. The plateauing of the DiscPRM-14B and Majority models indicates that they may have reached their learning capacity with the given dataset and architecture, and further increasing the training data may not lead to significant improvements. The ThinkPRM-14B (1K) model shows a steady increase in accuracy, suggesting that it could potentially benefit from even more training data. The choice of model and the amount of training data are crucial factors in achieving high accuracy on the MATH-500 dataset.
```