## Line Chart: Scaling Training Data - MATH-500
### Overview
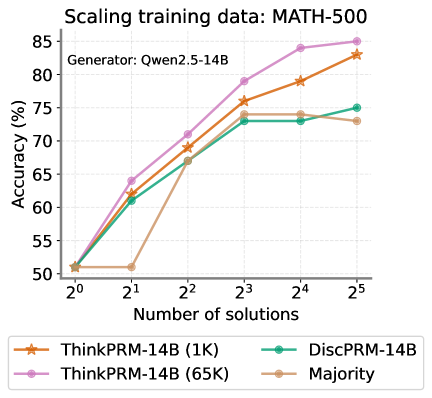
This line chart illustrates the relationship between the number of solutions used for training and the resulting accuracy on the MATH-500 dataset. The chart compares the performance of different models: ThinkPRM-14B (trained with 1K solutions), ThinkPRM-14B (trained with 65K solutions), DiscPRM-14B, and a "Majority" model. The generator used for all models is Qwen2.5-14B.
### Components/Axes
* **Title:** Scaling training data: MATH-500
* **X-axis:** Number of solutions. Scale is logarithmic, with markers at 2⁰, 2¹, 2², 2³, 2⁴, and 2⁵.
* **Y-axis:** Accuracy (%). Scale ranges from 50% to 85%.
* **Legend:** Located at the bottom-right of the chart.
* ThinkPRM-14B (1K) - Orange line with star markers.
* ThinkPRM-14B (65K) - Purple line with circle markers.
* DiscPRM-14B - Teal line with diamond markers.
* Majority - Brown line with plus markers.
* **Generator:** Qwen2.5-14B (located at the top-left of the chart)
### Detailed Analysis
Here's a breakdown of each data series and their trends:
* **ThinkPRM-14B (1K) - Orange:** Starts at approximately 51% accuracy at 2⁰ solutions. The line slopes upward, reaching approximately 72% at 2² solutions, 78% at 2³ solutions, 81% at 2⁴ solutions, and 83% at 2⁵ solutions.
* **ThinkPRM-14B (65K) - Purple:** Begins at approximately 51% accuracy at 2⁰ solutions. The line increases steadily, reaching approximately 73% at 2² solutions, 79% at 2³ solutions, 83% at 2⁴ solutions, and 85% at 2⁵ solutions.
* **DiscPRM-14B - Teal:** Starts at approximately 51% accuracy at 2⁰ solutions. The line rises to approximately 68% at 2² solutions, 73% at 2³ solutions, 74% at 2⁴ solutions, and then decreases slightly to approximately 72% at 2⁵ solutions.
* **Majority - Brown:** Starts at approximately 51% accuracy at 2⁰ solutions. The line increases rapidly, reaching approximately 66% at 2¹ solutions, 70% at 2² solutions, 77% at 2³ solutions, 80% at 2⁴ solutions, and 82% at 2⁵ solutions.
### Key Observations
* All models start with similar accuracy (around 51%) at the lowest number of solutions (2⁰).
* ThinkPRM-14B (65K) consistently achieves the highest accuracy across all numbers of solutions.
* DiscPRM-14B shows a plateau and slight decrease in accuracy at higher numbers of solutions (2⁴ and 2⁵).
* ThinkPRM-14B (1K) and Majority models exhibit similar trends, with the Majority model slightly outperforming ThinkPRM-14B (1K) at 2⁴ and 2⁵.
### Interpretation
The data suggests that increasing the number of training solutions generally improves accuracy for these models on the MATH-500 dataset. The ThinkPRM-14B model, when trained with 65K solutions, demonstrates the best performance, indicating that a larger training dataset is beneficial for this model. The DiscPRM-14B model's performance plateaus and slightly declines with more solutions, which could indicate overfitting or diminishing returns from additional training data. The Majority model performs well, suggesting that a simple majority voting approach can be effective, especially with a sufficient number of solutions. The consistent starting point for all models suggests that the initial performance is likely determined by the generator (Qwen2.5-14B) rather than the specific training data size. The logarithmic scale on the x-axis emphasizes the impact of increasing the number of solutions, particularly at higher values.