## Line Chart: Scaling training data: MATH-500
### Overview
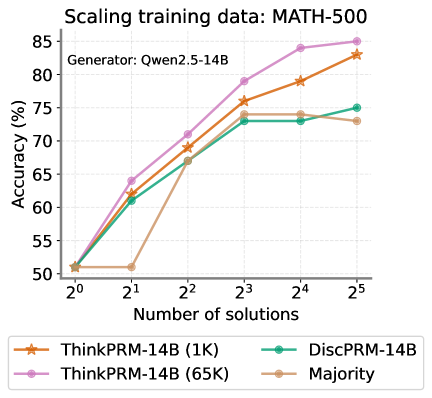
The chart illustrates the relationship between the number of training solutions (x-axis) and accuracy percentage (y-axis) for different model configurations. Four data series are compared, showing performance trends as training data scales from 1 solution (2⁰) to 32 solutions (2⁵).
### Components/Axes
- **X-axis**: "Number of solutions" (logarithmic scale: 2⁰ to 2⁵)
- **Y-axis**: "Accuracy (%)" (linear scale: 50% to 85%)
- **Legend**:
- Orange stars: ThinkPRM-14B (1K)
- Green circles: DiscPRM-14B
- Purple diamonds: ThinkPRM-14B (65K)
- Beige squares: Majority
- **Title**: "Scaling training data: MATH-500" (top-center)
### Detailed Analysis
1. **ThinkPRM-14B (1K)** (orange stars):
- Starts at ~50% at 2⁰
- Sharp rise to ~60% at 2¹
- Gradual increase to ~82% at 2⁵
- Steady upward trend with no plateaus
2. **DiscPRM-14B** (green circles):
- Begins at ~50% at 2⁰
- Rapid growth to ~75% at 2³
- Plateaus at ~75% from 2³ to 2⁵
- Slight dip to ~73% at 2⁵
3. **ThinkPRM-14B (65K)** (purple diamonds):
- Starts at ~50% at 2⁰
- Consistent upward trajectory
- Reaches ~85% at 2⁴
- Maintains ~85% at 2⁵
- Highest performance across all scales
4. **Majority** (beige squares):
- Flat line at ~50% until 2²
- Sharp rise to ~73% at 2³
- Slight decline to ~72% at 2⁵
- Most volatile trend with initial stagnation
### Key Observations
- **Performance Correlation**: All models show improved accuracy with increased training data, but ThinkPRM-14B (65K) demonstrates the strongest scaling efficiency.
- **DiscPRM-14B Plateau**: Performance stabilizes after 2³ solutions, suggesting diminishing returns at higher data volumes.
- **Majority Method Limitations**: Initial stagnation (50% until 2²) indicates poor generalization without sufficient data.
- **Model Variants**: The 65K variant of ThinkPRM-14B outperforms the 1K version by ~25% at maximum scale (2⁵).
### Interpretation
The data suggests that model performance on MATH-500 is highly sensitive to training data quantity. ThinkPRM-14B (65K) achieves near-optimal results with 32 solutions, while DiscPRM-14B shows saturation at 8 solutions. The Majority method's poor initial performance highlights the importance of diverse training data over simple majority voting. The logarithmic x-axis emphasizes exponential scaling benefits, with most gains occurring between 2¹ and 2³ solutions. The chart underscores the value of large-scale training data for complex reasoning tasks, with ThinkPRM-14B (65K) representing the most effective configuration for this benchmark.