## Heatmap: Dataset Performance Comparison
### Overview
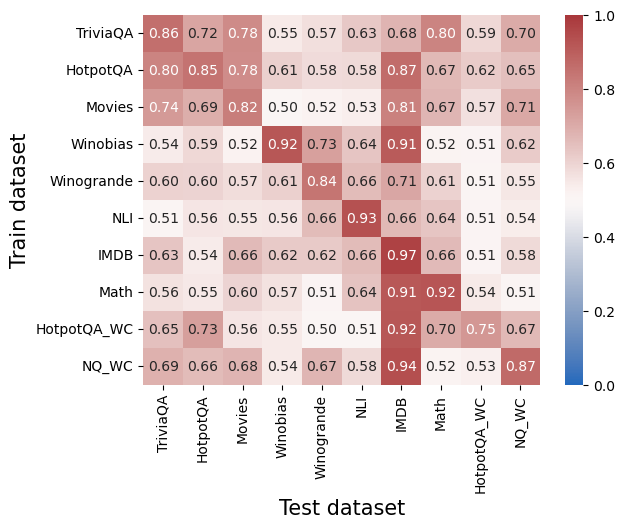
The image is a heatmap visualizing the performance of different models trained on various datasets and tested on the same or different datasets. The color intensity represents the performance score, ranging from blue (low) to red (high), with corresponding numerical values displayed in each cell. The rows represent the training datasets, and the columns represent the testing datasets.
### Components/Axes
* **Title:** None explicitly present in the image.
* **X-axis (Test dataset):**
* Categories: TriviaQA, HotpotQA, Movies, Winobias, Winogrande, NLI, IMDB, Math, HotpotQA\_WC, NQ\_WC
* **Y-axis (Train dataset):**
* Categories: TriviaQA, HotpotQA, Movies, Winobias, Winogrande, NLI, IMDB, Math, HotpotQA\_WC, NQ\_WC
* **Colorbar (Right side):**
* Scale: Ranges from 0.0 (blue) to 1.0 (red) in increments of 0.2.
### Detailed Analysis
The heatmap displays performance scores for each combination of training and testing datasets. The scores range from approximately 0.50 to 0.97.
Here's a breakdown of the values:
* **TriviaQA:**
* Trained on TriviaQA: 0.86
* Tested on:
* TriviaQA: 0.86
* HotpotQA: 0.72
* Movies: 0.78
* Winobias: 0.55
* Winogrande: 0.57
* NLI: 0.63
* IMDB: 0.68
* Math: 0.80
* HotpotQA\_WC: 0.59
* NQ\_WC: 0.70
* **HotpotQA:**
* Trained on HotpotQA: 0.80
* Tested on:
* TriviaQA: 0.80
* HotpotQA: 0.85
* Movies: 0.78
* Winobias: 0.61
* Winogrande: 0.58
* NLI: 0.58
* IMDB: 0.87
* Math: 0.67
* HotpotQA\_WC: 0.62
* NQ\_WC: 0.65
* **Movies:**
* Trained on Movies: 0.74
* Tested on:
* TriviaQA: 0.74
* HotpotQA: 0.69
* Movies: 0.82
* Winobias: 0.50
* Winogrande: 0.52
* NLI: 0.53
* IMDB: 0.81
* Math: 0.67
* HotpotQA\_WC: 0.57
* NQ\_WC: 0.71
* **Winobias:**
* Trained on Winobias: 0.54
* Tested on:
* TriviaQA: 0.54
* HotpotQA: 0.59
* Movies: 0.52
* Winobias: 0.92
* Winogrande: 0.73
* NLI: 0.64
* IMDB: 0.91
* Math: 0.52
* HotpotQA\_WC: 0.51
* NQ\_WC: 0.62
* **Winogrande:**
* Trained on Winogrande: 0.60
* Tested on:
* TriviaQA: 0.60
* HotpotQA: 0.60
* Movies: 0.57
* Winobias: 0.61
* Winogrande: 0.84
* NLI: 0.66
* IMDB: 0.71
* Math: 0.61
* HotpotQA\_WC: 0.51
* NQ\_WC: 0.55
* **NLI:**
* Trained on NLI: 0.51
* Tested on:
* TriviaQA: 0.51
* HotpotQA: 0.56
* Movies: 0.55
* Winobias: 0.56
* Winogrande: 0.66
* NLI: 0.93
* IMDB: 0.66
* Math: 0.64
* HotpotQA\_WC: 0.51
* NQ\_WC: 0.54
* **IMDB:**
* Trained on IMDB: 0.63
* Tested on:
* TriviaQA: 0.63
* HotpotQA: 0.54
* Movies: 0.66
* Winobias: 0.62
* Winogrande: 0.62
* NLI: 0.66
* IMDB: 0.97
* Math: 0.66
* HotpotQA\_WC: 0.51
* NQ\_WC: 0.58
* **Math:**
* Trained on Math: 0.56
* Tested on:
* TriviaQA: 0.56
* HotpotQA: 0.55
* Movies: 0.60
* Winobias: 0.57
* Winogrande: 0.51
* NLI: 0.64
* IMDB: 0.91
* Math: 0.92
* HotpotQA\_WC: 0.54
* NQ\_WC: 0.51
* **HotpotQA\_WC:**
* Trained on HotpotQA\_WC: 0.65
* Tested on:
* TriviaQA: 0.65
* HotpotQA: 0.73
* Movies: 0.56
* Winobias: 0.55
* Winogrande: 0.50
* NLI: 0.51
* IMDB: 0.92
* Math: 0.70
* HotpotQA\_WC: 0.75
* NQ\_WC: 0.67
* **NQ\_WC:**
* Trained on NQ\_WC: 0.69
* Tested on:
* TriviaQA: 0.69
* HotpotQA: 0.66
* Movies: 0.68
* Winobias: 0.54
* Winogrande: 0.67
* NLI: 0.58
* IMDB: 0.94
* Math: 0.52
* HotpotQA\_WC: 0.53
* NQ\_WC: 0.87
### Key Observations
* The diagonal elements (training and testing on the same dataset) generally have higher scores, indicating better performance when the model is tested on data similar to what it was trained on.
* The IMDB dataset shows high performance when used as the test set, regardless of the training dataset.
* Winobias, NLI, IMDB, and Math datasets show high performance when trained and tested on themselves.
### Interpretation
The heatmap illustrates the transferability of models across different datasets. Training and testing on the same dataset generally yields the best performance, suggesting that models are highly specialized to the characteristics of their training data. However, some datasets, like IMDB, appear to be more generalizable, as models trained on other datasets perform relatively well when tested on IMDB. The lower off-diagonal scores indicate that models trained on one dataset may not perform as well on datasets with different characteristics or distributions. The high self-performance of Winobias, NLI, IMDB, and Math suggests these datasets have unique features that allow models to learn effectively when trained and tested on them.