\n
## Heatmap: Cross-Dataset Transfer Performance
### Overview
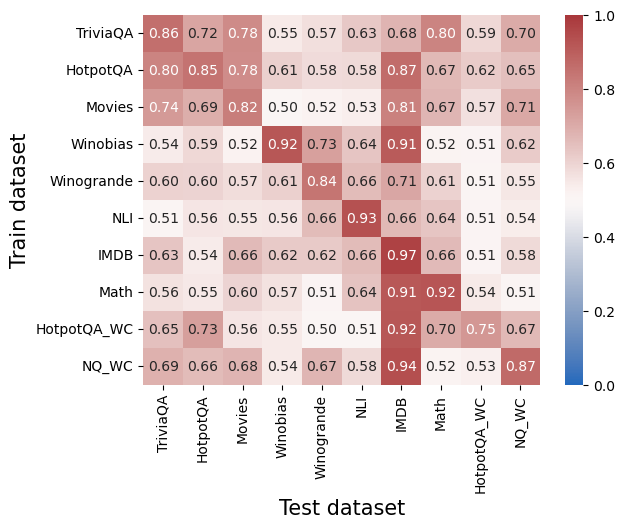
This image presents a heatmap visualizing the transfer performance between different datasets used for training and testing. The heatmap displays the correlation or similarity in performance when a model trained on one dataset (rows) is evaluated on another dataset (columns). The color intensity represents the performance metric, with warmer colors (reds) indicating higher performance and cooler colors (blues) indicating lower performance.
### Components/Axes
* **X-axis:** "Test dataset" - Lists the datasets used for testing: TriviaQA, HotpotQA, Movies, Winobias, Winogrande, NLI, IMDB, Math, HotpotQA\_WC, NQ\_WC.
* **Y-axis:** "Train dataset" - Lists the datasets used for training: TriviaQA, HotpotQA, Movies, Winobias, Winogrande, NLI, IMDB, Math, HotpotQA\_WC, NQ\_WC.
* **Color Scale (Legend):** Located on the right side of the heatmap. Ranges from 0.0 (blue) to 1.0 (red), representing the performance metric. The scale is linear.
* **Cells:** Each cell represents the performance metric when a model trained on the corresponding row dataset is tested on the corresponding column dataset.
### Detailed Analysis
The heatmap contains 10x10 cells, each with a numerical value representing the performance metric. Here's a breakdown of the values, reading row by row:
* **TriviaQA:**
* TriviaQA - 0.86
* HotpotQA - 0.72
* Movies - 0.78
* Winobias - 0.55
* Winogrande - 0.57
* NLI - 0.63
* IMDB - 0.68
* Math - 0.80
* HotpotQA\_WC - 0.59
* NQ\_WC - 0.70
* **HotpotQA:**
* TriviaQA - 0.80
* HotpotQA - 0.85
* Movies - 0.78
* Winobias - 0.61
* Winogrande - 0.58
* NLI - 0.58
* IMDB - 0.87
* Math - 0.67
* HotpotQA\_WC - 0.62
* NQ\_WC - 0.65
* **Movies:**
* TriviaQA - 0.74
* HotpotQA - 0.69
* Movies - 0.82
* Winobias - 0.50
* Winogrande - 0.52
* NLI - 0.53
* IMDB - 0.81
* Math - 0.67
* HotpotQA\_WC - 0.57
* NQ\_WC - 0.71
* **Winobias:**
* TriviaQA - 0.54
* HotpotQA - 0.59
* Movies - 0.52
* Winobias - 0.92
* Winogrande - 0.73
* NLI - 0.64
* IMDB - 0.91
* Math - 0.52
* HotpotQA\_WC - 0.51
* NQ\_WC - 0.62
* **Winogrande:**
* TriviaQA - 0.60
* HotpotQA - 0.60
* Movies - 0.57
* Winobias - 0.61
* Winogrande - 0.84
* NLI - 0.66
* IMDB - 0.71
* Math - 0.61
* HotpotQA\_WC - 0.51
* NQ\_WC - 0.55
* **NLI:**
* TriviaQA - 0.51
* HotpotQA - 0.56
* Movies - 0.55
* Winobias - 0.56
* Winogrande - 0.66
* NLI - 0.93
* IMDB - 0.66
* Math - 0.64
* HotpotQA\_WC - 0.51
* NQ\_WC - 0.54
* **IMDB:**
* TriviaQA - 0.63
* HotpotQA - 0.54
* Movies - 0.66
* Winobias - 0.62
* Winogrande - 0.62
* NLI - 0.66
* IMDB - 0.97
* Math - 0.66
* HotpotQA\_WC - 0.51
* NQ\_WC - 0.58
* **Math:**
* TriviaQA - 0.56
* HotpotQA - 0.55
* Movies - 0.60
* Winobias - 0.57
* Winogrande - 0.51
* NLI - 0.64
* IMDB - 0.91
* Math - 0.92
* HotpotQA\_WC - 0.54
* NQ\_WC - 0.51
* **HotpotQA\_WC:**
* TriviaQA - 0.65
* HotpotQA - 0.73
* Movies - 0.56
* Winobias - 0.55
* Winogrande - 0.50
* NLI - 0.51
* IMDB - 0.92
* Math - 0.70
* HotpotQA\_WC - 0.75
* NQ\_WC - 0.67
* **NQ\_WC:**
* TriviaQA - 0.69
* HotpotQA - 0.66
* Movies - 0.68
* Winobias - 0.54
* Winogrande - 0.67
* NLI - 0.58
* IMDB - 0.94
* Math - 0.52
* HotpotQA\_WC - 0.53
* NQ\_WC - 0.87
### Key Observations
* **High Self-Transfer:** The diagonal cells (e.g., TriviaQA trained on TriviaQA tested) consistently show the highest values, close to 1.0, indicating that models perform best when tested on the same dataset they were trained on.
* **IMDB and Math Transfer:** IMDB and Math show strong transfer performance to other datasets, particularly Winobias, and each other.
* **Winobias Performance:** Winobias shows relatively low transfer performance *from* most other datasets, but high performance when trained and tested on itself.
* **Winogrande Performance:** Winogrande shows moderate transfer performance, generally better than Winobias but lower than TriviaQA or HotpotQA.
* **WC Datasets:** The "WC" (Weakly Supervised Contrastive) datasets (HotpotQA\_WC and NQ\_WC) show generally lower transfer performance compared to their non-WC counterparts.
### Interpretation
This heatmap demonstrates the challenges of cross-dataset transfer learning. While models can achieve high performance on the dataset they are trained on, their performance degrades when applied to different datasets. This suggests that the datasets have different characteristics, biases, or require different types of reasoning. The strong performance of IMDB and Math in transferring to other datasets might indicate that these datasets capture more generalizable features or reasoning skills. The lower performance of the WC datasets suggests that the weakly supervised contrastive learning approach may not lead to as robust or transferable representations. The heatmap provides valuable insights for selecting appropriate training datasets and developing more robust transfer learning techniques. The differences in performance highlight the importance of domain adaptation and the need for models that can generalize across diverse datasets.