\n
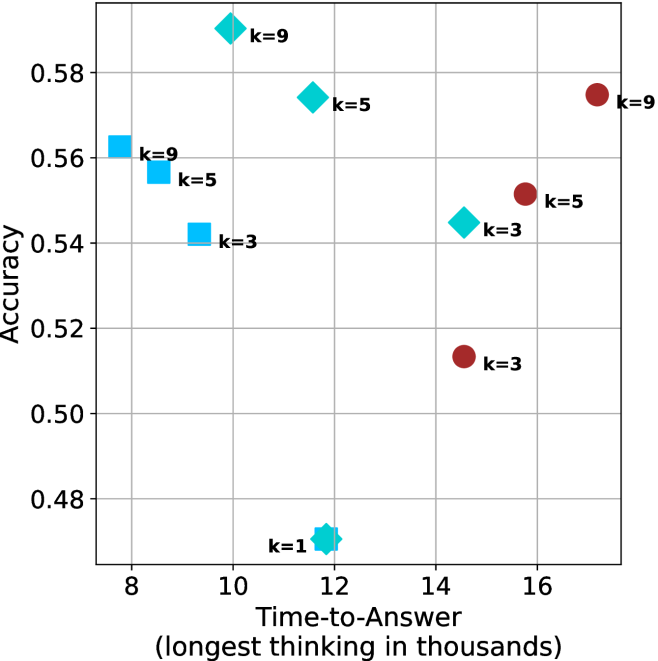
## Scatter Plot: Accuracy vs. Time-to-Answer for Different k Values
### Overview
This image presents a scatter plot illustrating the relationship between Accuracy and Time-to-Answer for different values of 'k'. Each point on the plot represents a data point with a specific 'k' value. The x-axis represents Time-to-Answer (in thousands), and the y-axis represents Accuracy. The plot uses different colors to distinguish data points based on their 'k' value.
### Components/Axes
* **X-axis:** Time-to-Answer (longest thinking in thousands). Scale ranges from approximately 8 to 17.
* **Y-axis:** Accuracy. Scale ranges from approximately 0.48 to 0.59.
* **Legend:** Located in the top-right corner, the legend maps colors to 'k' values:
* Blue: k=1
* Cyan: k=3
* Light Blue: k=5
* Red: k=9
* **Data Points:** Scatter points representing the accuracy and time-to-answer for each k value. Each point is labeled with its corresponding 'k' value.
### Detailed Analysis
The plot shows the following data points:
* **k=1:** (Approximately 12.2, 0.47). This point is blue.
* **k=3:** (Approximately 10.2, 0.54). This point is cyan.
* **k=3:** (Approximately 14.5, 0.52). This point is cyan.
* **k=5:** (Approximately 8.3, 0.56). This point is light blue.
* **k=5:** (Approximately 10.5, 0.57). This point is light blue.
* **k=5:** (Approximately 15.5, 0.55). This point is light blue.
* **k=9:** (Approximately 10.1, 0.58). This point is red.
* **k=9:** (Approximately 16.2, 0.58). This point is red.
**Trends:**
* For k=3, there is a slight positive trend as Time-to-Answer increases, Accuracy decreases.
* For k=5, there is a slight negative trend as Time-to-Answer increases, Accuracy decreases.
* For k=9, the accuracy remains relatively constant as Time-to-Answer increases.
* k=1 has the lowest accuracy and a relatively short Time-to-Answer.
### Key Observations
* The data points for k=9 consistently exhibit the highest accuracy values.
* The data points for k=1 exhibit the lowest accuracy.
* There is a noticeable spread in Time-to-Answer values for k=5, suggesting variability in performance.
* The data does not show a strong, clear correlation between Time-to-Answer and Accuracy across all 'k' values.
### Interpretation
The scatter plot suggests that the parameter 'k' significantly influences the accuracy of the system being evaluated. Higher values of 'k' (specifically k=9) are associated with higher accuracy, while lower values (k=1) result in lower accuracy. The Time-to-Answer appears to have a less consistent relationship with accuracy, and its effect seems to be modulated by the value of 'k'.
The variability in Time-to-Answer for k=5 could indicate that the system's performance is more sensitive to other factors when k=5. The relatively constant accuracy for k=9 across different Time-to-Answer values suggests that the system reaches a performance ceiling with this parameter setting.
This data could be used to optimize the 'k' parameter for the system to achieve the desired balance between accuracy and response time. Further investigation might be needed to understand the underlying reasons for the observed trends and to identify the factors that contribute to the variability in Time-to-Answer for k=5.