## Scatter Plot: Accuracy vs. Time-to-Answer for Different k-values
### Overview
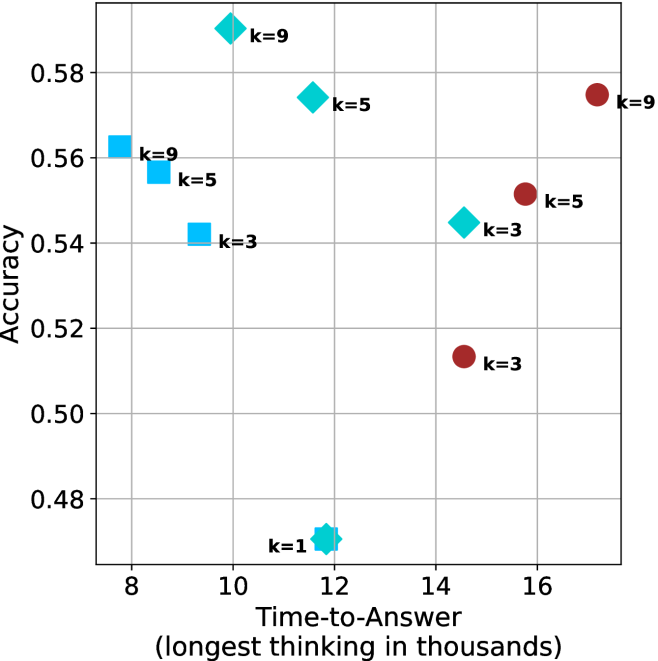
The image is a scatter plot comparing the performance of three distinct methods or models (differentiated by marker shape and color) across two metrics: **Accuracy** (y-axis) and **Time-to-Answer** (x-axis). Each data point is labeled with a parameter `k`, which appears to be a variable (e.g., number of neighbors, steps, or candidates) ranging from 1 to 9. The plot reveals a trade-off between speed and accuracy, with different methods occupying different regions of the performance space.
### Components/Axes
* **X-Axis:** Labeled **"Time-to-Answer (longest thinking in thousands)"**. The scale runs from approximately 7.5 to 17.5, with major tick marks at 8, 10, 12, 14, and 16. The unit is "thousands," suggesting the values represent thousands of operations, milliseconds, or another time-based unit.
* **Y-Axis:** Labeled **"Accuracy"**. The scale runs from 0.48 to 0.59, with major tick marks at 0.48, 0.50, 0.52, 0.54, 0.56, and 0.58.
* **Data Series (Inferred from Marker Style):** There is no explicit legend. The series are distinguished by marker shape and color:
1. **Cyan Squares:** Clustered on the left side of the plot (lower Time-to-Answer).
2. **Cyan Diamonds:** Distributed across the middle of the plot.
3. **Red Circles:** Clustered on the right side of the plot (higher Time-to-Answer).
* **Data Point Labels:** Each marker is annotated with text indicating the `k` value (e.g., "k=9", "k=5", "k=3", "k=1").
### Detailed Analysis
**Data Points by Series:**
* **Cyan Square Series (Left Cluster):**
* `k=9`: Accuracy ≈ 0.563, Time-to-Answer ≈ 7.8
* `k=5`: Accuracy ≈ 0.555, Time-to-Answer ≈ 8.5
* `k=3`: Accuracy ≈ 0.542, Time-to-Answer ≈ 9.5
* *Trend:* As `k` decreases, Accuracy decreases slightly while Time-to-Answer increases moderately.
* **Cyan Diamond Series (Middle Distribution):**
* `k=9`: Accuracy ≈ 0.590, Time-to-Answer ≈ 10.0
* `k=5`: Accuracy ≈ 0.575, Time-to-Answer ≈ 11.5
* `k=3`: Accuracy ≈ 0.545, Time-to-Answer ≈ 14.5
* `k=1`: Accuracy ≈ 0.470, Time-to-Answer ≈ 12.0
* *Trend:* For `k=9, 5, 3`, as `k` decreases, Accuracy decreases and Time-to-Answer increases. The `k=1` point is a significant outlier, showing the lowest accuracy but not the highest time.
* **Red Circle Series (Right Cluster):**
* `k=9`: Accuracy ≈ 0.575, Time-to-Answer ≈ 17.0
* `k=5`: Accuracy ≈ 0.552, Time-to-Answer ≈ 15.5
* `k=3`: Accuracy ≈ 0.515, Time-to-Answer ≈ 14.5
* *Trend:* As `k` decreases, both Accuracy and Time-to-Answer decrease.
### Key Observations
1. **Performance Clustering:** The three marker types occupy distinct regions. Cyan squares are fast but mid-accuracy. Cyan diamonds offer a range of accuracy (including the highest) at medium speed. Red circles are the slowest but can achieve high accuracy at high `k`.
2. **Impact of `k`:** For the Cyan Diamond and Red Circle series, higher `k` values consistently yield higher accuracy. The relationship with time is less uniform.
3. **Outlier:** The Cyan Diamond `k=1` point (Accuracy ≈ 0.47) is a clear outlier, performing significantly worse in accuracy than all other points, despite having a moderate Time-to-Answer (~12).
4. **Speed-Accuracy Trade-off:** The plot visualizes a classic trade-off. The fastest method (Cyan Square `k=9`) has good accuracy (0.563). The most accurate method (Cyan Diamond `k=9`) is slower (Time=10). The slowest method (Red Circle `k=9`) has high accuracy (0.575) but is not the most accurate.
### Interpretation
This chart likely compares different algorithmic approaches or model configurations for a task requiring both deliberation (thinking time) and correctness. The `k` parameter is a key tuning knob.
* **Cyan Squares** represent a **"Fast but Limited"** approach. It's highly efficient (low time) but its accuracy ceiling is lower, and it doesn't benefit as dramatically from increasing `k`.
* **Cyan Diamonds** represent a **"Balanced and Scalable"** approach. It can achieve the peak accuracy in the chart, and its performance scales well with `k`, though at a cost of increased time. The poor performance at `k=1` suggests this method requires a minimum level of deliberation (`k>=3`) to be effective.
* **Red Circles** represent a **"Deliberate and High-Cost"** approach. It is inherently slower, but can reach high accuracy levels when given a high `k` value. Its performance degrades more steeply as `k` is reduced compared to the other methods.
The choice of method depends on the application's priority: if speed is critical, the Cyan Square method is best. If maximum accuracy is paramount and time is less constrained, the Cyan Diamond method with high `k` is optimal. The Red Circle method may be preferable if its specific characteristics (not shown, e.g., robustness, memory use) are beneficial, despite its higher time cost. The outlier at `k=1` for the Cyan Diamond method indicates a critical failure mode or threshold effect for that configuration.