## Scatter Plot: Accuracy vs. Time-to-Answer for Different k Values
### Overview
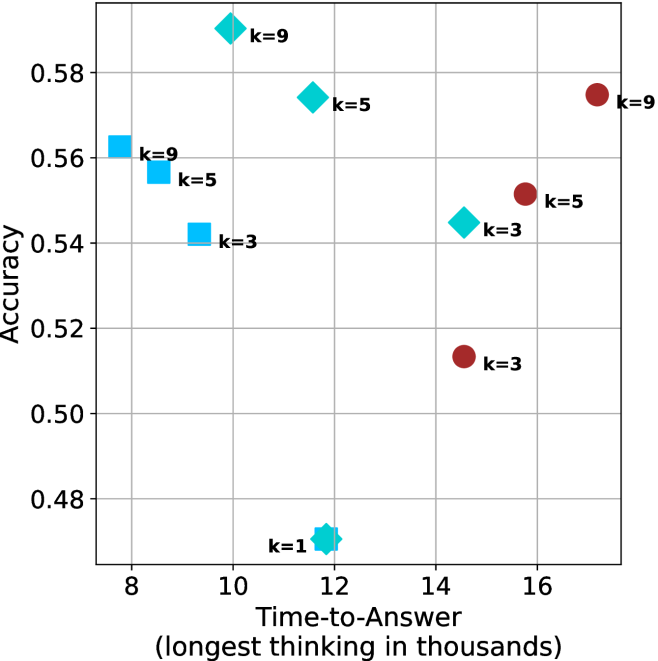
The image is a scatter plot comparing **accuracy** (y-axis) and **time-to-answer** (x-axis, in thousands of units) for different values of a parameter `k`. Three distinct marker types (squares, diamonds, circles) represent `k=3`, `k=5`, and `k=9`, with a fourth outlier marker (`k=1`) included. The plot highlights trade-offs between accuracy and computational time for varying `k` values.
---
### Components/Axes
- **X-axis**: "Time-to-Answer (longest thinking in thousands)"
- Scale: 8 to 16 (discrete grid lines).
- **Y-axis**: "Accuracy"
- Scale: 0.48 to 0.58 (discrete grid lines).
- **Legend**: Positioned on the right.
- `k=3`: Blue squares.
- `k=5`: Cyan diamonds.
- `k=9`: Red circles.
- `k=1`: Cyan star (outlier).
---
### Detailed Analysis
#### Data Points by `k` Value
1. **`k=9` (Red Circles)**
- (9, 0.56)
- (10, 0.58)
- (17, 0.58)
2. **`k=5` (Cyan Diamonds)**
- (10, 0.56)
- (12, 0.57)
- (15, 0.55)
3. **`k=3` (Blue Squares)**
- (9, 0.54)
- (12, 0.53)
- (14, 0.52)
4. **`k=1` (Cyan Star)**
- (10, 0.48)
---
### Key Observations
1. **Accuracy-Time Trade-off**:
- Higher `k` values (e.g., `k=9`) achieve higher accuracy (0.56–0.58) but require longer time-to-answer (9–17k).
- Lower `k` values (e.g., `k=1`) have significantly lower accuracy (0.48) but shorter processing time (10k).
2. **Trends by `k`**:
- **`k=9`**: Accuracy plateaus at 0.58 for time-to-answer ≥10k.
- **`k=5`**: Peaks at 0.57 (12k) before declining slightly.
- **`k=3`**: Shows a gradual decline in accuracy with increasing time.
- **`k=1`**: Outlier with the lowest accuracy (0.48) at 10k.
3. **Outliers**:
- The `k=1` point (10k, 0.48) deviates from the trend of higher `k` values improving accuracy.
---
### Interpretation
- **Trade-off Insight**: The data suggests a clear trade-off between accuracy and computational efficiency. Higher `k` values improve accuracy but increase processing time, which may be impractical for real-time applications.
- **Optimal `k` Selection**:
- For applications prioritizing accuracy, `k=9` is optimal despite longer time.
- For time-sensitive tasks, `k=5` balances moderate accuracy (0.55–0.57) with mid-range time (10–15k).
- **Anomaly**: The `k=1` point (0.48 accuracy) may indicate underfitting or insufficient model complexity, warranting further investigation.
- **Scalability**: The plateau in `k=9` accuracy at 10k+ time suggests diminishing returns beyond this threshold.
This analysis underscores the need to align `k` selection with application-specific constraints (e.g., latency vs. precision requirements).