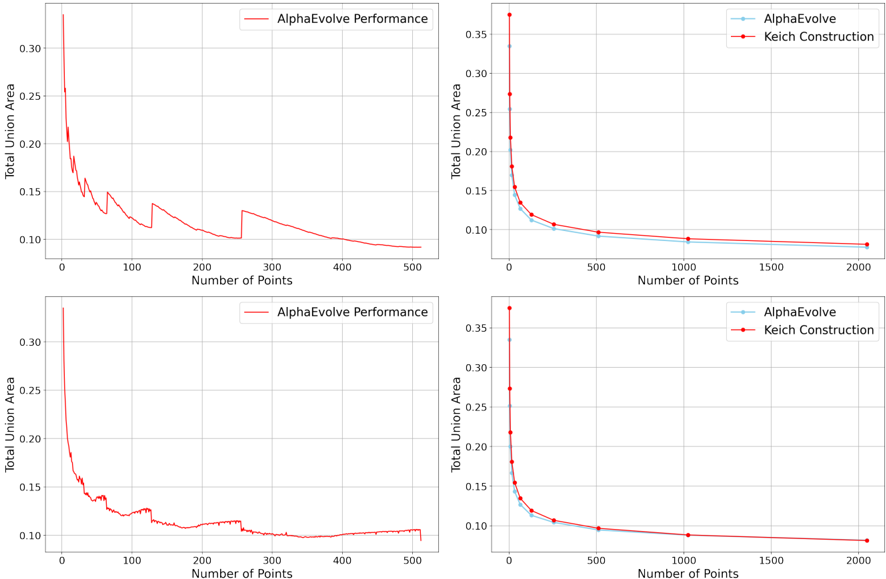
## Line Charts: AlphaEvolve Performance vs. Keich Construction
### Overview
The image contains four line charts comparing the performance of "AlphaEvolve" and "Keich Construction" algorithms, measured by "Total Union Area" against the "Number of Points". The charts are arranged in a 2x2 grid. The top-left and bottom-left charts show "AlphaEvolve Performance" over a range of 0-500 points. The top-right and bottom-right charts compare "AlphaEvolve" and "Keich Construction" over a range of 0-2000 points.
### Components/Axes
* **X-axis (Horizontal):** "Number of Points". The top-left and bottom-left charts range from 0 to 500. The top-right and bottom-right charts range from 0 to 2000.
* **Y-axis (Vertical):** "Total Union Area". All charts range from 0.10 to 0.35.
* **Legends (Top-Right and Bottom-Right Charts):**
* Light Blue: "AlphaEvolve"
* Red: "Keich Construction"
* **Legends (Top-Left and Bottom-Left Charts):**
* Red: "AlphaEvolve Performance"
### Detailed Analysis
**Top-Left Chart: AlphaEvolve Performance (0-500 Points)**
* **AlphaEvolve Performance (Red):** The line starts at approximately 0.33 at 0 points, rapidly decreases to around 0.15 by 50 points, then continues to decrease more gradually with some upward spikes, reaching approximately 0.10 at 500 points. The line has a jagged appearance between 50 and 300 points, with several small upward jumps.
**Bottom-Left Chart: AlphaEvolve Performance (0-500 Points)**
* **AlphaEvolve Performance (Red):** The line starts at approximately 0.33 at 0 points, rapidly decreases to around 0.15 by 50 points, then continues to decrease more gradually with some upward spikes, reaching approximately 0.10 at 500 points. The line has a jagged appearance between 50 and 300 points, with several small upward jumps. This chart is nearly identical to the top-left chart.
**Top-Right Chart: AlphaEvolve vs. Keich Construction (0-2000 Points)**
* **AlphaEvolve (Light Blue):** The line starts at approximately 0.36 at 0 points, rapidly decreases to around 0.11 by 250 points, then continues to decrease more gradually, reaching approximately 0.08 at 2000 points.
* **Keich Construction (Red):** The line starts at approximately 0.36 at 0 points, rapidly decreases to around 0.13 by 250 points, then continues to decrease more gradually, reaching approximately 0.08 at 2000 points. The Keich Construction line is consistently slightly above the AlphaEvolve line.
**Bottom-Right Chart: AlphaEvolve vs. Keich Construction (0-2000 Points)**
* **AlphaEvolve (Light Blue):** The line starts at approximately 0.36 at 0 points, rapidly decreases to around 0.11 by 250 points, then continues to decrease more gradually, reaching approximately 0.08 at 2000 points.
* **Keich Construction (Red):** The line starts at approximately 0.36 at 0 points, rapidly decreases to around 0.13 by 250 points, then continues to decrease more gradually, reaching approximately 0.08 at 2000 points. The Keich Construction line is consistently slightly above the AlphaEvolve line. This chart is nearly identical to the top-right chart.
### Key Observations
* The "Total Union Area" decreases as the "Number of Points" increases for all algorithms.
* The decrease in "Total Union Area" is most rapid in the initial phase (0-250 points).
* "Keich Construction" consistently has a slightly higher "Total Union Area" than "AlphaEvolve" in the top-right and bottom-right charts.
* The top-left and bottom-left charts show the same data.
* The top-right and bottom-right charts show the same data.
### Interpretation
The charts suggest that both "AlphaEvolve" and "Keich Construction" algorithms improve their performance (lower "Total Union Area") as the number of points increases. The initial increase in points leads to a significant performance boost, with diminishing returns as the number of points continues to rise. "Keich Construction" appears to have a slightly higher "Total Union Area" than "AlphaEvolve", indicating potentially slightly worse performance. The duplication of charts suggests a possible error or an intention to highlight specific aspects of the data. The jaggedness of the AlphaEvolve Performance line in the top-left and bottom-left charts between 50 and 300 points indicates instability or variability in the algorithm's performance within that range.