## Charts: AlphaEvolve Performance vs. Keich Construction
### Overview
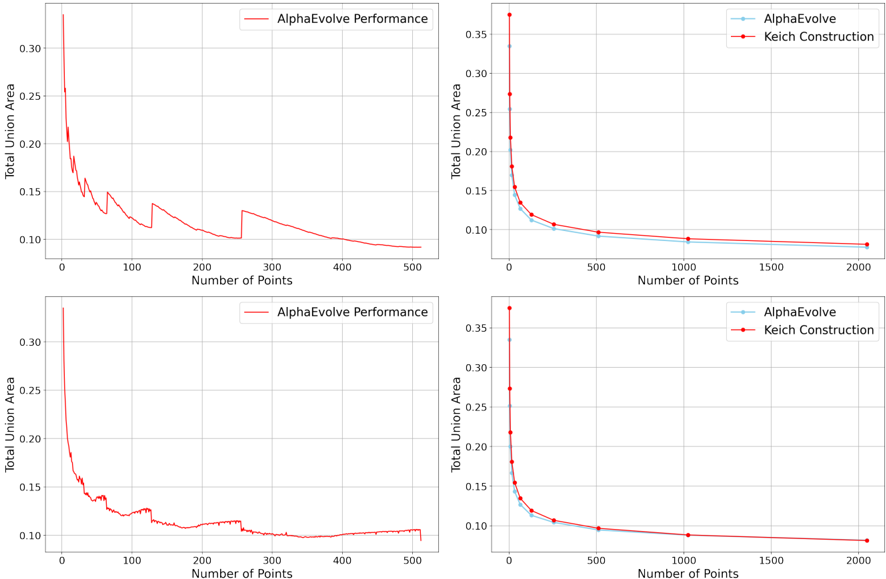
The image contains four line charts comparing the performance of "AlphaEvolve" and "Keich Construction" algorithms. Each chart plots "Total Union Area" against "Number of Points". The charts appear to be examining how the algorithms scale with increasing data points.
### Components/Axes
* **X-axis:** "Number of Points" - Ranges from 0 to approximately 2000.
* **Y-axis:** "Total Union Area" - Ranges from approximately 0.08 to 0.35.
* **Data Series:**
* "AlphaEvolve" (represented by a blue dashed line with triangle markers)
* "Keich Construction" (represented by a red solid line with circle markers)
* **Legends:** Located in the top-right corner of the top two charts and bottom-right corner of the bottom two charts.
### Detailed Analysis or Content Details
**Chart 1 (Top-Left):**
* **AlphaEvolve Performance (Red):** The line starts at approximately 0.28 at 0 points, rapidly decreases to around 0.12 at 50 points, and then plateaus around 0.10-0.11 from approximately 200 points onwards.
* **Trend:** The line initially shows a steep downward slope, indicating a rapid decrease in Total Union Area with increasing points, then flattens out.
**Chart 2 (Top-Right):**
* **AlphaEvolve (Blue):** The line starts at approximately 0.32 at 0 points, decreases to around 0.15 at 200 points, and then continues to decrease slowly, reaching approximately 0.10 at 2000 points.
* **Keich Construction (Red):** The line starts at approximately 0.30 at 0 points, decreases rapidly to around 0.12 at 200 points, and then plateaus around 0.10-0.11 from approximately 500 points onwards.
* **Trends:** Both lines show a decreasing trend, but AlphaEvolve decreases more gradually over the entire range. Keich Construction shows a steeper initial decrease, then levels off.
**Chart 3 (Bottom-Left):**
* **AlphaEvolve Performance (Red):** Similar to Chart 1, the line starts at approximately 0.28 at 0 points, rapidly decreases to around 0.12 at 50 points, and then plateaus around 0.10-0.11 from approximately 200 points onwards.
* **Trend:** Identical to Chart 1.
**Chart 4 (Bottom-Right):**
* **AlphaEvolve (Blue):** The line starts at approximately 0.32 at 0 points, decreases to around 0.15 at 200 points, and then continues to decrease slowly, reaching approximately 0.10 at 2000 points.
* **Keich Construction (Red):** The line starts at approximately 0.30 at 0 points, decreases rapidly to around 0.12 at 200 points, and then plateaus around 0.10-0.11 from approximately 500 points onwards.
* **Trends:** Identical to Chart 2.
### Key Observations
* Both algorithms show a decreasing Total Union Area as the Number of Points increases.
* Keich Construction appears to converge to a lower Total Union Area faster than AlphaEvolve.
* The charts 1 and 3 are identical, as are charts 2 and 4.
* AlphaEvolve exhibits a more gradual decrease in Total Union Area, especially at higher point counts.
### Interpretation
The data suggests that both AlphaEvolve and Keich Construction algorithms reduce the Total Union Area as more data points are considered. However, Keich Construction achieves this reduction more quickly, potentially indicating a faster convergence rate. AlphaEvolve maintains a more gradual reduction, which might be desirable in scenarios where a smoother, less abrupt change in Total Union Area is preferred. The identical nature of the top two charts and the bottom two charts suggests that these are either independent runs of the same experiment or different views of the same underlying data. The initial high Total Union Area values could represent the area before any optimization or construction process is applied, and the decreasing trend represents the improvement achieved by the algorithms. The plateauing of the lines indicates that the algorithms reach a point of diminishing returns, where adding more points does not significantly reduce the Total Union Area.