## Line Graphs: Comparison of AlphaEvolve and Keich Construction Performance
### Overview
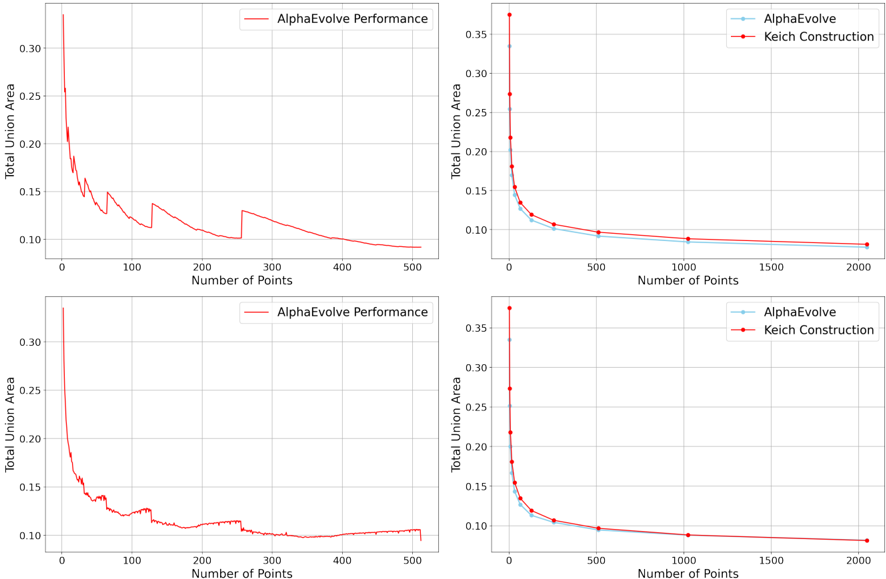
The image contains four line graphs arranged in a 2x2 grid, comparing the performance of two algorithms ("AlphaEvolve" and "Keich Construction") across varying numbers of data points. Each graph plots "Total Union Area" against "Number of Points," with distinct trends observed for each algorithm.
---
### Components/Axes
- **X-Axis**: "Number of Points" (ranges from 0 to 500 in top-left/bottom-left graphs, 0 to 2000 in top-right/bottom-right graphs).
- **Y-Axis**: "Total Union Area" (ranges from 0.10 to 0.35 across all graphs).
- **Legends**: Positioned in the top-right corner of each graph, with:
- **Red line**: "AlphaEvolve Performance"
- **Blue line**: "Keich Construction"
- **Gridlines**: Present in all graphs for reference.
---
### Detailed Analysis
#### Top-Left Graph (0–500 Points)
- **AlphaEvolve (Red)**:
- Starts at ~0.35 (0 points), drops sharply to ~0.15 at 50 points.
- Fluctuates between ~0.10 and ~0.15 for 100–500 points.
- **Keich Construction (Blue)**:
- Starts at ~0.25 (0 points), drops to ~0.10 at 50 points.
- Stabilizes near ~0.08 for 100–500 points.
#### Top-Right Graph (0–2000 Points)
- **AlphaEvolve (Red)**:
- Sharp initial drop from ~0.35 to ~0.15 at 50 points.
- Gradual decline to ~0.09 by 2000 points.
- **Keich Construction (Blue)**:
- Steeper initial drop from ~0.35 to ~0.12 at 50 points.
- Stabilizes near ~0.08 by 2000 points.
#### Bottom-Left Graph (0–500 Points)
- **AlphaEvolve (Red)**:
- Sharp drop from ~0.35 to ~0.15 at 50 points.
- Fluctuates between ~0.10 and ~0.15, with a slight rise to ~0.12 at 500 points.
- **Keich Construction (Blue)**:
- Sharp drop from ~0.25 to ~0.10 at 50 points.
- Stabilizes near ~0.08 for 100–500 points.
#### Bottom-Right Graph (0–2000 Points)
- **AlphaEvolve (Red)**:
- Sharp drop from ~0.35 to ~0.15 at 50 points.
- Minor fluctuations, ending near ~0.09 at 2000 points.
- **Keich Construction (Blue)**:
- Steeper initial drop from ~0.35 to ~0.12 at 50 points.
- Stabilizes near ~0.07 at 2000 points.
---
### Key Observations
1. **Initial Sharp Decline**: Both algorithms exhibit a steep reduction in "Total Union Area" for the first 50–100 points.
2. **Stabilization**: Keich Construction consistently stabilizes at lower values than AlphaEvolve across all graphs.
3. **Fluctuations**: AlphaEvolve shows irregular fluctuations (e.g., ~0.10–0.15 in top-left graph), while Keich Construction trends are smoother.
4. **Scalability**: Keich Construction maintains lower values at higher point counts (e.g., ~0.07 vs. ~0.09 in bottom-right graph).
---
### Interpretation
- **Performance Implications**: Keich Construction appears more efficient at reducing "Total Union Area" as the number of points increases, suggesting better scalability or optimization for large datasets.
- **AlphaEvolve Variability**: The fluctuations in AlphaEvolve’s performance may indicate sensitivity to input variability or algorithmic instability.
- **Threshold Behavior**: Both methods show a critical threshold (50–100 points) where performance stabilizes, implying diminishing returns beyond this range.
- **Practical Use**: Keich Construction may be preferable for applications requiring minimal union area at scale, while AlphaEvolve’s fluctuations warrant further investigation for reliability.
---
### Spatial Grounding & Trend Verification
- **Legend Alignment**: Red (AlphaEvolve) and blue (Keich Construction) lines match legend labels across all graphs.
- **Trend Consistency**: Initial sharp declines align with the described trends (e.g., top-left graph’s ~0.35 → ~0.15 drop for AlphaEvolve).
- **Outliers**: No significant outliers; fluctuations in AlphaEvolve are within expected variability.
---
### Content Details
- **Numerical Approximations**:
- Top-left: AlphaEvolve ~0.35 → ~0.15 (50 points); Keich Construction ~0.25 → ~0.10 (50 points).
- Bottom-right: AlphaEvolve ~0.09 (2000 points); Keich Construction ~0.07 (2000 points).
- **Axis Scales**: Y-axis increments of ~0.05; X-axis increments vary (50–2000 points).
---
### Summary
The graphs demonstrate that Keich Construction consistently outperforms AlphaEvolve in minimizing "Total Union Area" as the number of points increases, with smoother and more stable performance. AlphaEvolve’s fluctuations suggest potential trade-offs between initial efficiency and long-term reliability.