## Line Graph: NLL Overfitting on CIFAR-100
### Overview
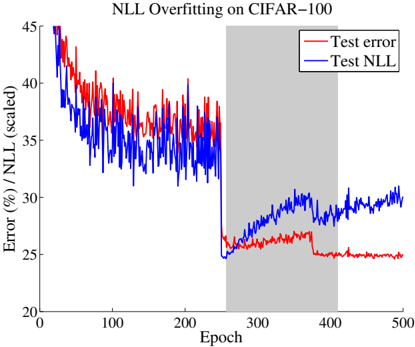
The image is a line graph comparing two metrics—Test Error and Test NLL—over 500 training epochs during a neural network's training on the CIFAR-100 dataset. The graph highlights overfitting behavior, with a shaded region marking a critical phase in training dynamics.
### Components/Axes
- **X-axis (Epoch)**: Labeled "Epoch," ranging from 0 to 500 in increments of 100.
- **Y-axis (Error %)**: Labeled "Error (%) / NLL (scaled)," ranging from 20% to 45% in increments of 5%.
- **Legend**: Located in the top-right corner, with:
- **Red line**: "Test error"
- **Blue line**: "Test NLL"
- **Shaded Region**: A gray vertical band spans epochs 250 to 400, likely indicating a phase transition (e.g., overfitting onset).
### Detailed Analysis
1. **Test Error (Red Line)**:
- Starts at ~45% at epoch 0.
- Decreases sharply to ~35% by epoch 100.
- Fluctuates between ~25% and ~35% until epoch 250.
- Stabilizes near ~25% from epoch 250 onward, with minor oscillations.
- **Key Trend**: Gradual improvement followed by stabilization.
2. **Test NLL (Blue Line)**:
- Begins at ~35% at epoch 0.
- Drops to ~25% by epoch 250, mirroring the Test Error trend.
- Rises sharply to ~30% by epoch 500, with increasing volatility.
- **Key Trend**: Initial improvement, followed by divergence and deterioration.
3. **Shaded Region (Epochs 250–400)**:
- Coincides with the divergence of the two lines.
- Test NLL begins its upward trend here, while Test Error plateaus.
### Key Observations
- **Divergence at Epoch 250**: The Test NLL (blue) begins to rise while Test Error (red) stabilizes, suggesting overfitting.
- **Test Error Stability**: The red line’s plateau indicates the model’s performance on test data no longer improves significantly after epoch 250.
- **Test NLL Volatility**: The blue line’s increasing oscillations after epoch 250 imply growing sensitivity to training data noise.
### Interpretation
The graph demonstrates classic overfitting behavior:
- **Initial Improvement**: Both metrics improve as the model learns meaningful patterns (epochs 0–250).
- **Overfitting Onset**: After epoch 250, the model memorizes training data, causing Test NLL to rise (blue line) while Test Error remains stable (red line). This divergence indicates the model’s loss function (NLL) becomes misaligned with generalization performance.
- **Shaded Region Significance**: The gray area marks the critical epoch range where overfitting becomes evident. The Test NLL’s rise suggests the model’s confidence in training data exceeds its ability to generalize, a hallmark of overfitting.
**Notable Anomalies**:
- Test Error’s minor fluctuations post-epoch 250 may reflect dataset noise or batch-specific variations.
- Test NLL’s sharp rise after epoch 400 could indicate further overfitting or dataset-specific challenges (e.g., class imbalance).
**Technical Implications**:
- The graph underscores the importance of monitoring both loss functions and test error during training.
- The divergence between Test Error and Test NLL highlights the need for regularization (e.g., dropout, weight decay) to mitigate overfitting in deep learning pipelines.