## Chart: Test Loss vs. Parameters
### Overview
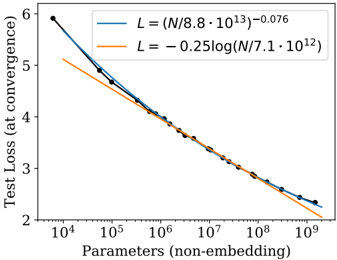
The image is a scatter plot showing the relationship between test loss (at convergence) and the number of parameters (non-embedding) in a model. The x-axis is on a logarithmic scale. Two trend lines are plotted, one representing a power law and the other a logarithmic function, both fitted to the data points.
### Components/Axes
* **X-axis:** Parameters (non-embedding), logarithmic scale ranging from 10^4 to 10^9.
* **Y-axis:** Test Loss (at convergence), linear scale ranging from 2 to 6.
* **Data Points:** Black dots representing individual data points.
* **Legend (top-right):**
* Blue line: L = (N / 8.8 * 10^13)^-0.076
* Orange line: L = -0.25 * log(N / 7.1 * 10^12)
### Detailed Analysis
* **Blue Line (Power Law):** L = (N / 8.8 * 10^13)^-0.076
* Trend: Decreases as the number of parameters increases.
* At N = 10^4, L ≈ 5.8
* At N = 10^9, L ≈ 2.2
* **Orange Line (Logarithmic):** L = -0.25 * log(N / 7.1 * 10^12)
* Trend: Decreases as the number of parameters increases.
* At N = 10^4, L ≈ 5.2
* At N = 10^9, L ≈ 2.3
* **Data Points (Black):**
* The data points generally follow the trend of both lines, with some scatter.
* The data points are more closely aligned with the blue line at lower parameter values and with the orange line at higher parameter values.
### Key Observations
* Both the power law and logarithmic functions provide a reasonable fit to the data.
* The test loss decreases as the number of parameters increases, indicating that larger models tend to have lower test loss.
* The power law function seems to fit the data better at lower parameter values, while the logarithmic function seems to fit better at higher parameter values.
### Interpretation
The plot demonstrates the relationship between model size (number of parameters) and generalization performance (test loss). The decreasing trend suggests that increasing the model size generally leads to better performance on the test set. The fact that both a power law and a logarithmic function can approximate the relationship indicates that the relationship is complex and may be influenced by various factors, such as the specific architecture of the model and the training data. The slight deviation of the data points from the trend lines suggests that there is some variability in the test loss for models with the same number of parameters.